Building a Production-Grade Medallion Architecture on Microsoft Fabric
An end-to-end Bronze → Silver → Gold build on Microsoft Fabric, orchestrated, monitored, and cost-optimized — using AdventureWorks as an on-premises source system, with everything that went wrong, got fixed, and got measured along the way.
Why This Project
Most "I built a medallion architecture" write-ups stop at the happy path: ingest, transform, model, ship a report. This one doesn't, on purpose. The goal wasn't to prove Fabric can ingest a SQL Server database into a Lakehouse — that part is well-documented and, frankly, easy. The goal was to push into the parts that don't appear in quickstart docs: row- and object-level security that actually enforces instead of just looking like it does, a certification workflow that functions as a real governance process rather than a checkbox, a FinOps pass that turns "this notebook feels slow" into a measured and attributable number, scheduled orchestration that is accountable for its own cost, live alerting tested against real triggered activity — and, because it happened, a genuine platform-level bug diagnosed through controlled isolation testing rather than guessing.
The full stack: on-premises SQL Server (AdventureWorks) → on-premises data gateway → Fabric Data Factory pipeline (weekly schedule, fan-out / fan-in orchestration) → Bronze Lakehouse → PySpark Silver and Gold notebooks → Direct Lake semantic model → certified, governed executive report → Workspace Monitoring + Activator alerting.
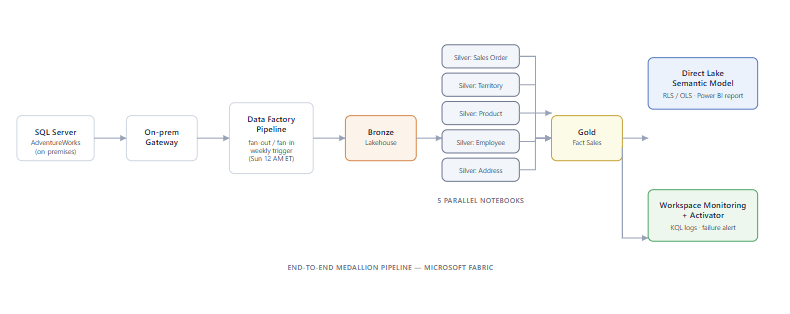
End-to-end medallion pipeline — SQL Server to Direct Lake semantic model with Workspace Monitoring
The three Lakehouses that form the physical medallion layers in the WS_LC-Dev workspace — each automatically provisioned with its own SQL analytics endpoint:
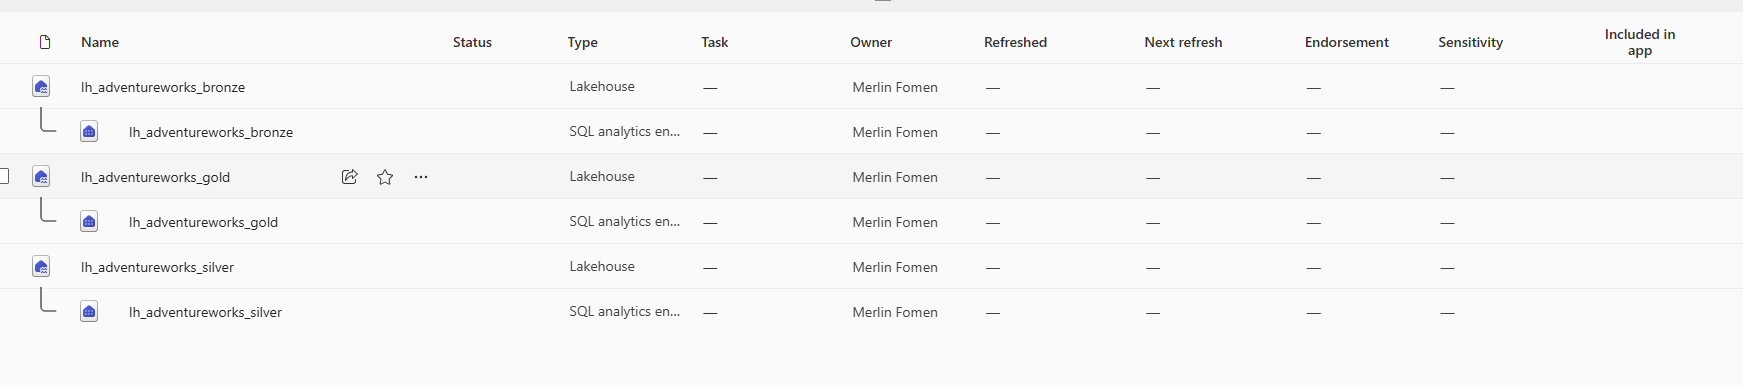
The three-layer Lakehouse structure in WS_LC-Dev — Bronze, Silver, and Gold each have a Lakehouse item and an auto-provisioned SQL analytics endpoint. No endorsement or sensitivity label yet — those come after the certification workflow in Part 4.
How to Use This Guide
This post is written as a reproducible build guide — not a summary of what was built, but a step-by-step walkthrough you can follow to build it yourself. Each Part opens with what needs to be in place before you start, walks through the configuration and the decisions, and flags the exact failure modes you are likely to hit.
Prerequisites
| Requirement | Notes |
|---|---|
| Microsoft Fabric capacity | F2 minimum; F8 recommended based on measured workload — see Part 6 |
| AdventureWorks 2025 | SQL Server database on a Windows machine you control |
| Microsoft 365 / Entra admin access | To create security groups and assign Fabric licences |
| Fabric tenant admin access | To enable gateway, Git, and certification settings in the Admin portal |
| GitHub account | For Git integration in Part 5 (free account is sufficient) |
| Tabular Editor 2 (free) | For Object-Level Security — tabulareditor.com |
| DAX Studio (free) | For RLS identity testing — daxstudio.org |
Build sequence
Each Part builds on the previous one. This table shows the order, what you produce, and what must already be in place:
| Step | Covers | What you build | Hard dependency |
|---|---|---|---|
| 0 | Gateway setup | Secure channel from on-premises SQL Server to Fabric | SQL Server running and reachable |
| 1 | Part 1 | Bronze ingestion pipeline + Silver and Gold PySpark notebooks | Gateway + connection working |
| 2 | Part 2 | Security groups, workspace roles, RLS, OLS, OneLake roles | Gold Lakehouse populated |
| 3 | Part 3 | Direct Lake semantic model + three-page executive report | Part 2 security layer in place |
| 4 | Part 4 | Certification, lineage view, Purview audit logging | Report published in Fabric |
| 5 | Part 5 | Git source control via GitHub | GitHub PAT (classic) and empty repo ready |
| 6 | Part 6 | FinOps measurement + capacity right-sizing | At least one full pipeline run complete |
| 7 | Part 7 | Fan-out / fan-in orchestration pipeline with weekly schedule | All notebooks tested individually |
| 8 | Part 8 | Workspace Monitoring KQL + Activator email alerting | Orchestration pipeline scheduled and running |
Joining at a specific part? The gateway setup and Part 1 are the hard dependencies — everything else builds on a populated Gold Lakehouse. Each subsequent Part lists exactly what needs to be in place at the top of the section.
Before You Start — Bridging On-Premises SQL Server to Microsoft Fabric
Before a single pipeline runs, Fabric needs a secure, authenticated channel to reach a database that sits behind a corporate firewall or on a local machine. That channel is the on-premises data gateway — a lightweight Windows service you install on a machine that can reach the SQL Server, which then relays encrypted traffic between the Fabric service and the on-premises source. Nothing in the Fabric cloud ever touches your database directly; the gateway is the only point of contact.
This step is often glossed over in tutorials because it is infrastructure, not data engineering. In practice it is the step that blocks the most beginners, because the gateway, the connection object, and the pipeline all have to be configured consistently before anything else works.
Step 1 — Install and register the gateway
Download the on-premises data gateway installer from aka.ms/opdg and run it on the Windows machine that hosts — or can network-reach — your SQL Server instance. Standard install mode (not personal mode) is required for Fabric pipelines.
The installer runs silently after accepting the terms — no configuration choices at this stage.
Once installation completes, the gateway registration screen opens. Three fields matter here:
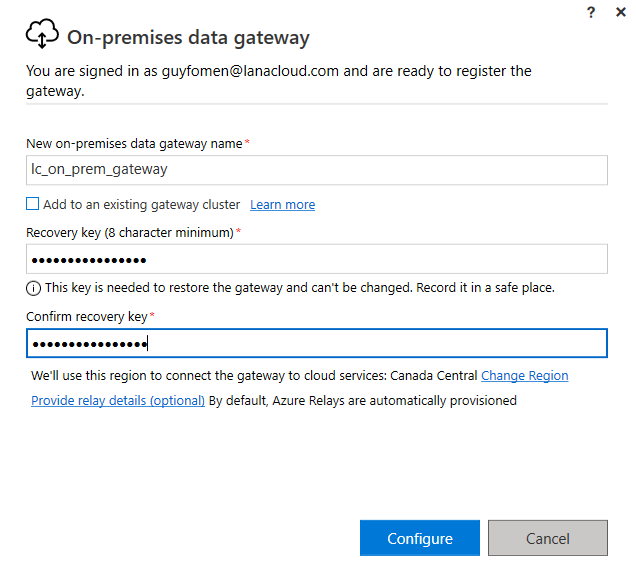
Registration form — name the gateway, set the recovery key, and confirm the region before clicking Configure.
| Field | Value used | Why it matters |
|---|---|---|
| Gateway name | lc_on_prem_gateway |
This name appears in Fabric's connection UI — make it descriptive and environment-prefixed |
| Recovery key | (stored in secrets vault) | Required to restore the gateway if the host machine changes or is rebuilt — store it before clicking Configure |
| Region | Canada Central | Must match your Fabric capacity region. A mismatch forces all traffic to cross regions, adding latency and potentially violating data residency requirements |
| Sign-in account | guyfomen@lanacloud.com |
The Entra account that "owns" the gateway — whoever manages it later needs access through this account |
After clicking Configure, wait for the status screen:
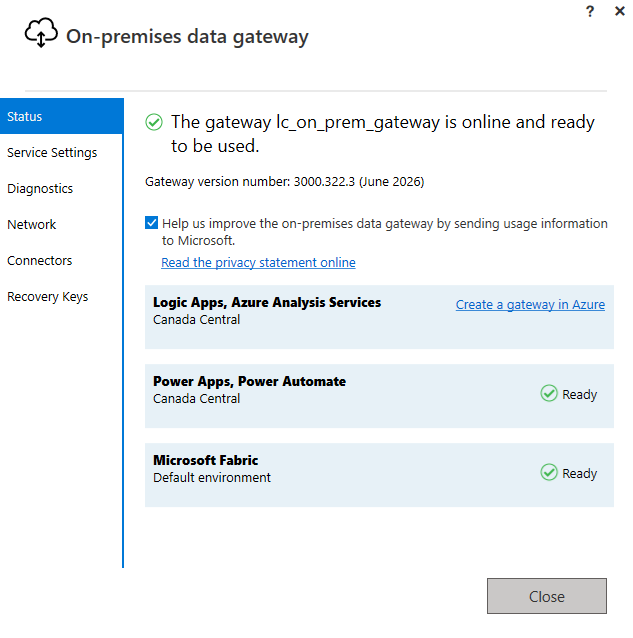
"The gateway lc_on_prem_gateway is online and ready to be used." — Microsoft Fabric (Default environment) shows Ready in the connected services list.
The connected services panel is the most important thing to verify on this screen. Microsoft Fabric must appear with "Ready" status. If it is missing or shows an error, the pipeline will fail to authenticate before it even reaches the SQL Server. Gateway version 3000.322.3 (June 2026 release) was used here.
Step 2 — Create the connection object in Fabric
The gateway makes the channel available; a connection object tells Fabric how to use it for a specific data source. In Fabric, go to Settings → Manage connections and gateways → New connection.
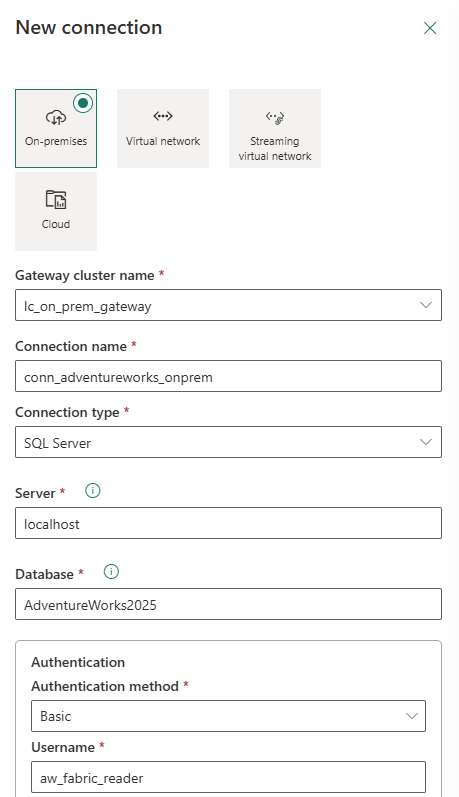
Connection form — connection type: On-premises. Gateway: lc_on_prem_gateway. Connector: SQL Server. Server: localhost. Database: AdventureWorks2025.
The connection configuration used for this project:
| Setting | Value |
|---|---|
| Connection type | On-premises |
| Gateway cluster | lc_on_prem_gateway |
| Connection name | conn_adventureworks_onprem |
| Data source type | SQL Server |
| Server | localhost |
| Database | AdventureWorks2025 |
| Authentication method | Basic |
| Username | aw_fabric_reader |
Two points worth emphasising about the credential and privacy settings at the bottom of the same form:
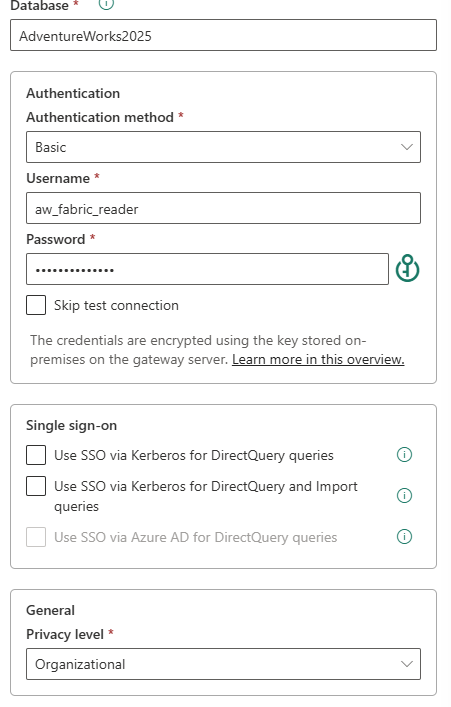
Credential note: "encrypted using the key stored on-premises on the gateway server" — the password never leaves the on-premises machine in plaintext. Privacy level: Organizational.
Dedicated service account, not a personal login. The username aw_fabric_reader is a SQL Server login created specifically for this pipeline with read-only access to AdventureWorks2025. Using a personal account means the pipeline breaks the moment that person changes their password or leaves the organisation. Using sa or a DBO-level account violates the principle of least privilege. A named, read-only service account is the right pattern.
Privacy level: Organizational. This setting controls how Power Query isolates this data source when combining it with others. "Private" would prevent the gateway from passing query results to any other source — which silently breaks pipelines that join data across connections. "None" removes isolation entirely. "Organizational" is the correct default for internal enterprise data: it allows data sharing within the Fabric tenant while keeping it isolated from external public sources.
SSO via Kerberos is available but was not enabled here. Kerberos SSO passes the end-user's Entra identity through to the SQL Server — useful when RLS is enforced at the database level, not needed when the service account already carries the correct permissions.
Step 3 — Verify the connection is registered
After saving, navigate to Manage connections and gateways to confirm the connection appears and shows a healthy status:
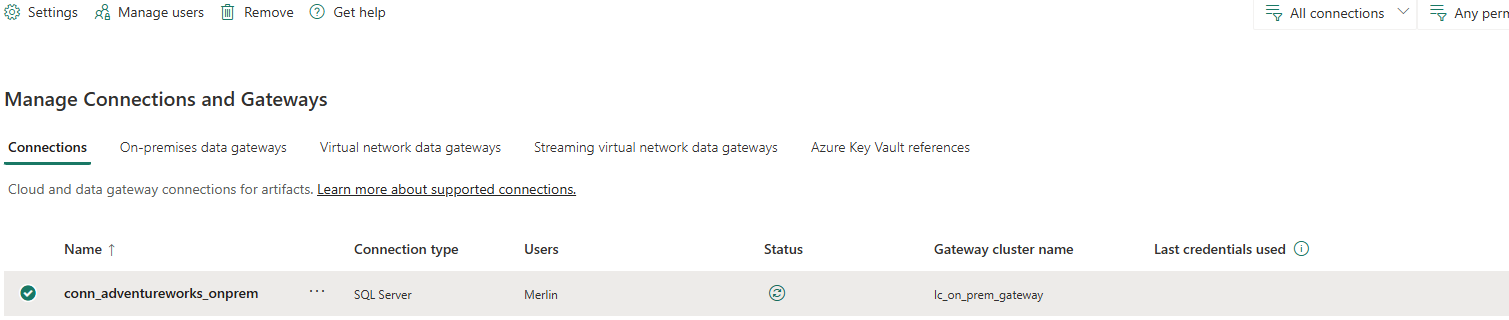
conn_adventureworks_onprem — SQL Server type, Gateway: lc_on_prem_gateway, Status: connected (green indicator).
conn_adventureworks_onprem appears with a green status indicator. This connection object is now available to select in any Fabric Data Factory pipeline activity that reads from AdventureWorks2025 — no re-entering credentials each time, no hardcoded passwords in pipeline parameters.
Learner note: If the status shows an error at this stage, check in this order: (1) Is the gateway service running on the host machine? (2) Does the machine have network access to the SQL Server on port 1433? (3) Is the
aw_fabric_readerlogin enabled in SQL Server with the correct database permissions? These three account for the majority of connection failures.
Part 1 — Modeling Decisions That Don't Show Up in Tutorials
Before starting this part: Bronze, Silver, and Gold Lakehouses must exist in the WS_LC-Dev workspace (they can be empty). The on-premises gateway and conn_adventureworks_onprem connection from the gateway setup must be working. Run the Bronze ingestion pipeline once to confirm data lands in lh_adventureworks_bronze before building the Silver and Gold notebooks.
A calendar dimension that tells the truth
Every Gold dimension in this project traces back to a real Bronze source table. dim_date doesn't — there is no Date table in AdventureWorks. It is generated directly in the Gold notebook using Spark's sequence() function, producing one row per calendar day across the full span of order activity.
The deliberate detail is continuity. Pulling distinct dates from fact_sales would produce rows only for days that had a sale, silently hiding every zero-activity day. A generated, continuous calendar means a "sales by day" trend correctly shows a gap as a gap, rather than that day simply not existing in the dataset. Small decision, but it is the difference between a date dimension that supports honest trend analysis and one that quietly lies by omission.
Resolving a many-to-many relationship without breaking grain
Building dim_customer surfaced a real modeling problem: BusinessEntityAddress is a genuine many-to-many bridge — a customer can have several address types on file (Billing, Shipping, Home, Main Office) simultaneously. A naïve join against that bridge causes fan-out: any customer with two address types ends up duplicated in dim_customer.
The fix was a Spark window function — partition by BusinessEntityID, order each partition by a business-defined priority (Main Office → Billing → Home → anything else), rank with row_number(), and keep only rank 1. That deterministically collapses the relationship into exactly one row per customer, based on a rule about which address matters most — not "whichever row Spark happened to read first."
from pyspark.sql import Window
from pyspark.sql.functions import row_number, when, col

# Priority: Main Office=1, Billing=2, Home=3, others=4
addr_priority = (
    when(col("AddressType") == "Main Office", 1)
    .when(col("AddressType") == "Billing", 2)
    .when(col("AddressType") == "Home", 3)
    .otherwise(4)
)

window_spec = Window.partitionBy("BusinessEntityID").orderBy(addr_priority)

dim_customer = (
    df_address_bridge
    .withColumn("AddrRank", row_number().over(window_spec))
    .filter(col("AddrRank") == 1)
    .drop("AddrRank")
)
It also surfaced something worth checking explicitly: 19,579 address records resolved against 19,119 distinct customers, meaning roughly 3.3% of customers had no address on file. That is a LEFT JOIN, not an INNER JOIN — those rows survive as nulls instead of silently vanishing — and it became its own data-quality check rather than a surprise discovered later in a report.
Treating a five-row table with the same rigor as a 121K-row fact
The dynamic RLS mapping table — linking a user's identity to their sales territory — could have been typed directly into the semantic model in Tabular Editor in under a minute. It went through the full Gold pipeline anyway, deliberately. Every other table has lineage back to a source, passes through the shared DQ framework, and is visible in OneLake like any other governed asset. Making one small lookup table the exception would mean anyone reviewing the architecture later has to remember "that one table is different." Consistency is itself a form of documentation.
Building the shared data quality framework — nb_dq_utils
Every Silver notebook in this project runs the same data quality checks, but none of them define DQ logic directly. Instead, each Silver notebook calls a single shared utility notebook — nb_dq_utils — that owns all the DQ infrastructure: structured logging and a check runner that halts the pipeline on failure.
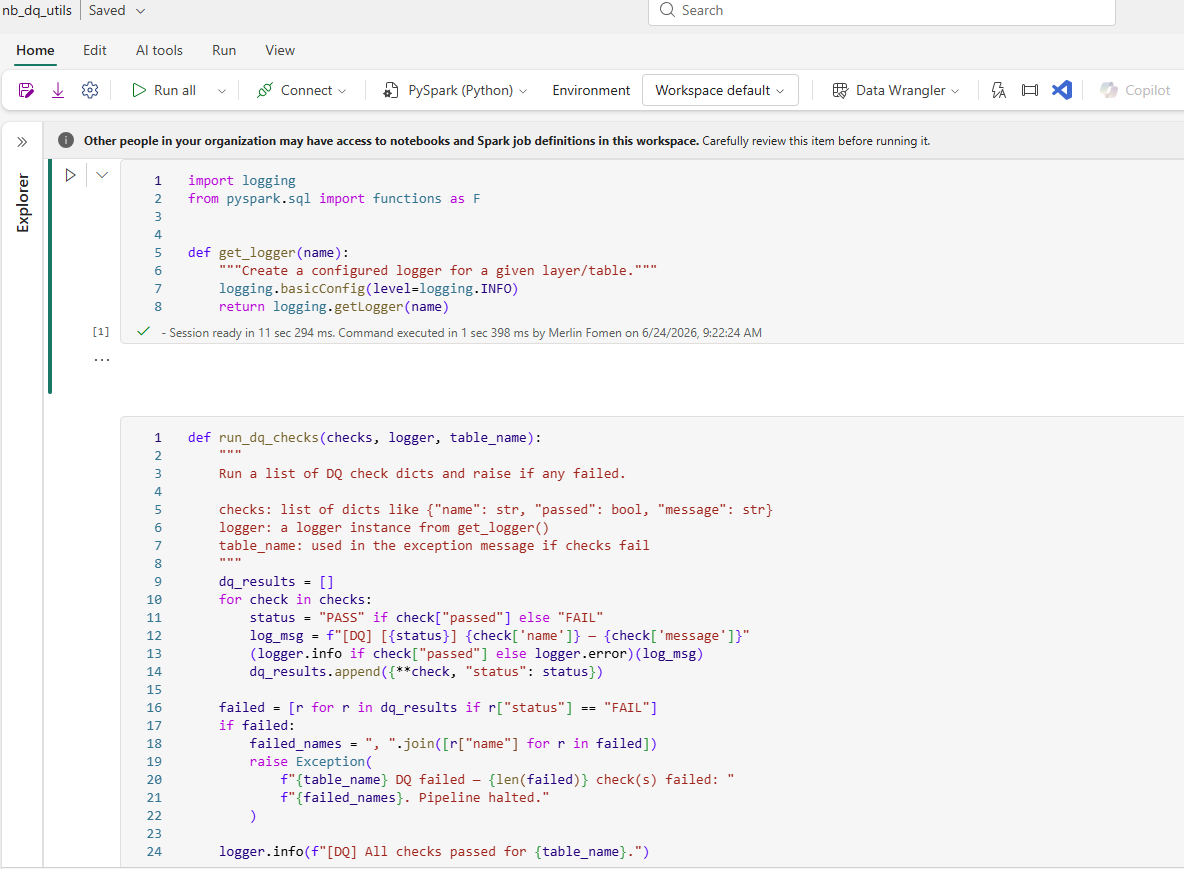
nb_dq_utils — the shared DQ utility notebook. Two functions are defined here and imported by every Silver notebook: get_logger for structured logging and run_dq_checks for executing and enforcing quality checks.
The notebook defines two functions:
get_logger(name) — creates a Python logging logger scoped to a specific layer and table name. Every log line is prefixed consistently, which matters in Part 8 when these messages flow into Workspace Monitoring's ItemJobEventLogs table and need to be distinguishable by notebook name.
run_dq_checks(checks, logger, table_name) — takes a list of check dictionaries, each with a name, a passed boolean, and a message string. It iterates the list, logs [DQ] [PASS] or [DQ] [FAIL] for each check, and — if any check fails — raises an Exception that immediately halts the notebook:
raise Exception(
    f"{table_name} DQ failed — {len(failed)} check(s) failed: "
    f"{failed_names}. Pipeline halted."
)
The Pipeline halted. suffix is not decorative. When the orchestration pipeline in Part 7 runs this Silver notebook as an activity and the notebook raises an exception, the activity status flips to Failed — and the Gold notebook downstream of it is never triggered. Bad data cannot reach the Gold layer silently; it stops the run and leaves a named, logged explanation.
Each Silver notebook calls nb_dq_utils via Fabric's %run magic and passes its own check list. A new check is a new dict entry — no changes to nb_dq_utils, no copy-pasted logic:
%run nb_dq_utils

logger = get_logger("silver.sales_order")

run_dq_checks([
    {
        "name": "no_null_sales_order_id",
        "passed": df_sales_order.filter(col("SalesOrderID").isNull()).count() == 0,
        "message": "SalesOrderID contains nulls"
    },
    {
        "name": "referential_integrity_product",
        "passed": df_sales_order.join(df_product, "ProductID", "left_anti").count() == 0,
        "message": "SalesOrderDetail rows reference ProductIDs not in dim_product"
    },
    {
        "name": "no_negative_line_total",
        "passed": df_sales_order.filter(col("LineTotal") < 0).count() == 0,
        "message": "Negative LineTotal values found"
    }
], logger, "sales_order")
The architectural decision behind this pattern — one shared utility, not five copies — is the same logic as the five-row RLS table going through the full pipeline: consistency means there is exactly one place to update when the DQ framework needs to change, one place to look when a check fails, and one set of log formats across every notebook.
Learner note — FinOps consequence: The shared
nb_dq_utilsnotebook appears in the Capacity Metrics app as its own line item (4.2% of workspace CU in Part 6). Even a utility notebook that does no Spark transformations has a session startup cost each time it is invoked. In high-frequency pipelines, consider whether DQ checks can be consolidated into the transformation notebook rather than a separate session. For this project's weekly schedule, the cost was acceptable.
Part 2 — Governance That Actually Enforces, Not Just Looks Like It
Before starting this part: Gold Lakehouse populated from at least one successful pipeline run (the fact_sales and dimension tables must exist). You need Entra admin access to create security groups and assign members, and both test user accounts must have Microsoft Fabric licences assigned in the Microsoft 365 admin centre.
Setting Up the Security Foundation
Every enforcement mechanism in this project traces back to three Entra security groups. Before any RLS rule, OneLake role, or workspace permission was configured, these groups had to exist and be consistently named — because every Fabric access control surface resolves membership through Entra at runtime, not through Fabric's own identity store.
Two accounts were provisioned in the Microsoft 365 Admin Center — Guy Merlin Fomen (gfomen@lanacloud.com) and Merlin Fomen (guyfomen@lanacloud.com), both with Microsoft Fabric (Free) licences:
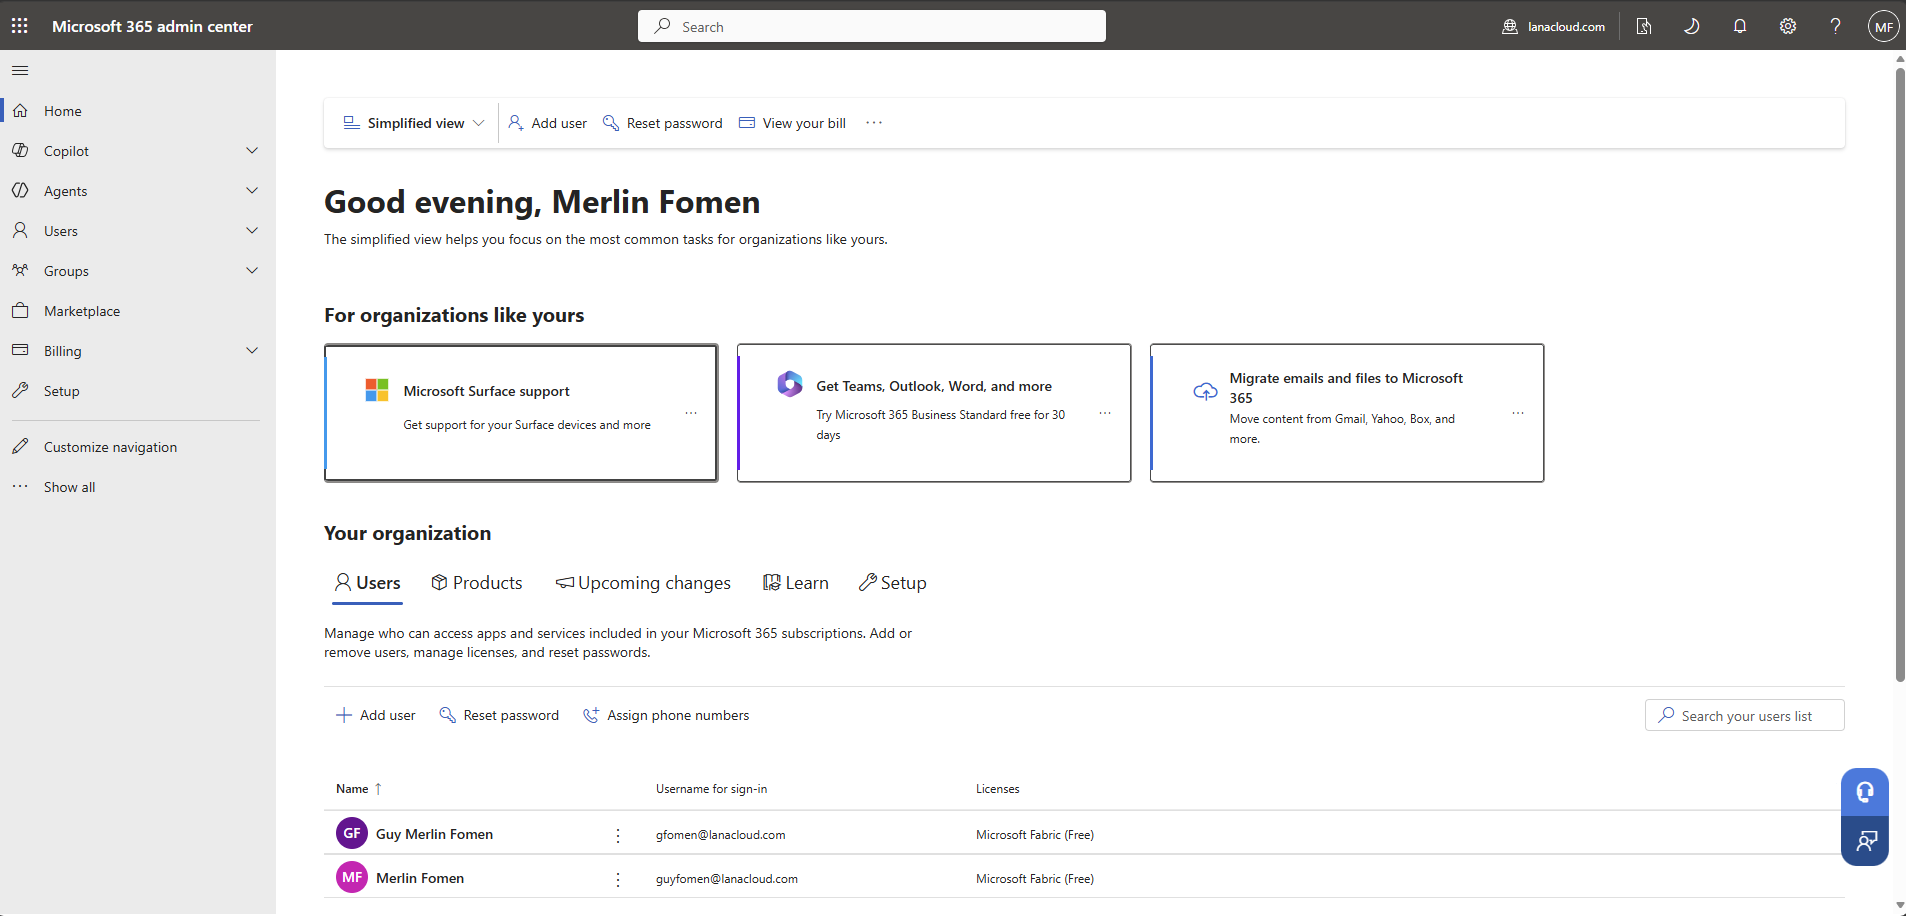
M365 Admin Center — two accounts with Microsoft Fabric (Free) licences. All access control is enforced through Entra groups rather than individual user assignments, so direct user management inside Fabric is minimal.
In Microsoft Entra, three security groups were created with Cloud source and Assigned membership — meaning membership is explicit and auditable, not computed dynamically:
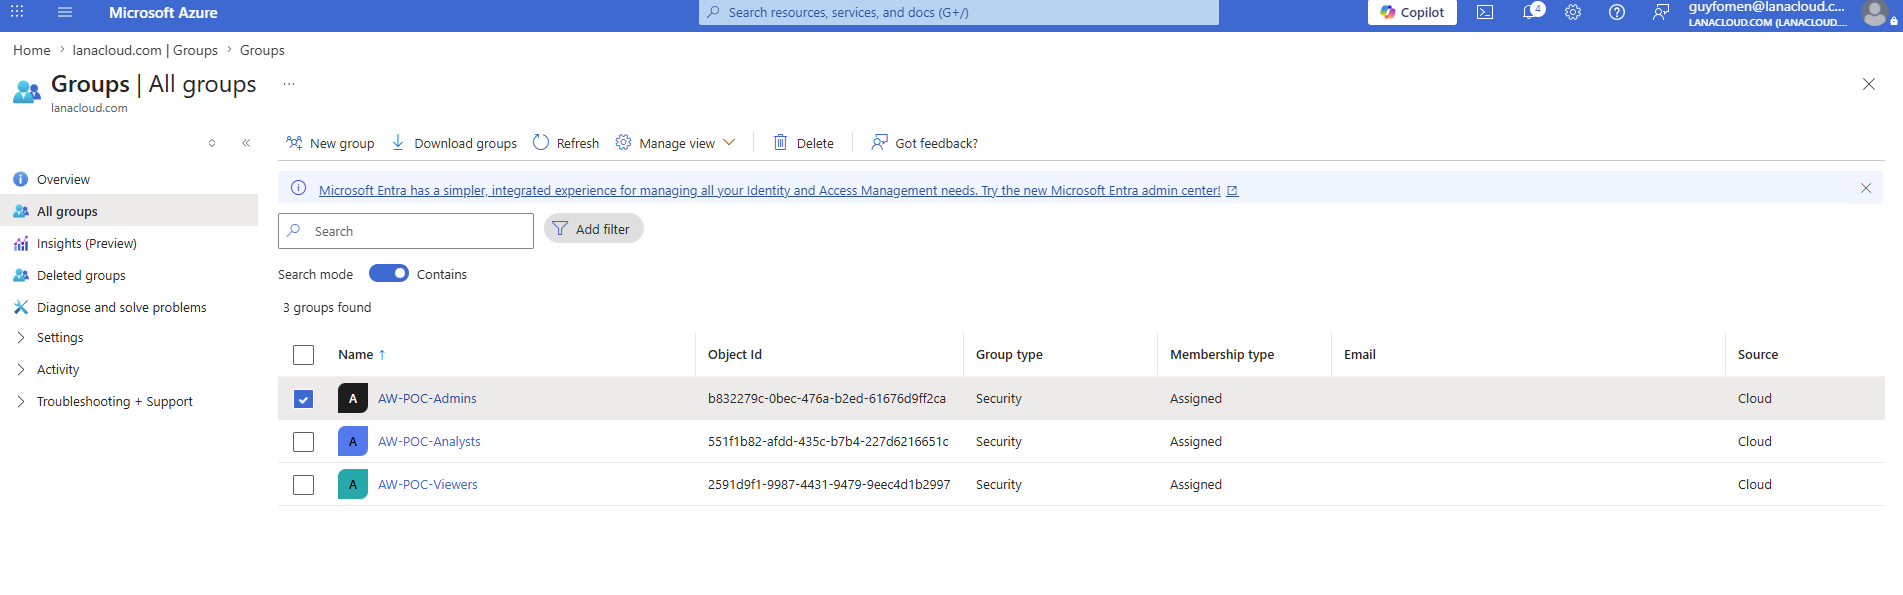
Entra Groups — three security groups: AW-POC-Admins, AW-POC-Analysts, AW-POC-Viewers. The Object IDs (b832279c..., 551f1b82..., 2591d9f1...) are what Fabric resolves when checking access — keep group names and IDs stable across environments.
With groups in place, the Fabric workspace WS_LC-Dev was configured in Manage access to assign each group a workspace role. Why both data-access groups receive the same Viewer role — rather than mapping Analysts to a higher role — is the subject of the next section:
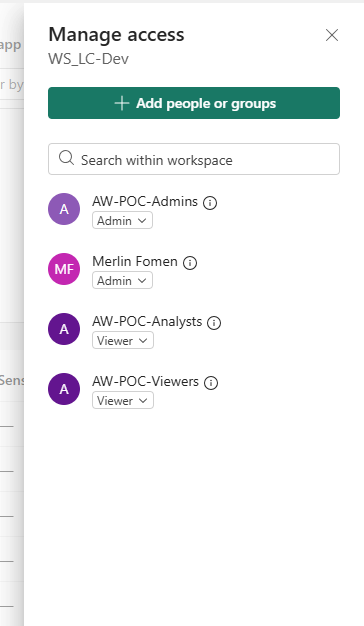
WS_LC-Dev Manage access — AW-POC-Admins and Merlin Fomen as Admin; both AW-POC-Analysts and AW-POC-Viewers as Viewer. The access differential between the two groups is enforced inside the semantic model's RLS, not at the workspace role level.
The naming trap: workspace roles are not RLS roles
It is tempting to map job titles onto Fabric workspace roles — "Analyst" sounds more senior than "Viewer." In Fabric's security model, that intuition works against you. A workspace role (Admin / Member / Contributor / Viewer) governs whether someone can edit Fabric items. Anyone at Contributor or above can open a semantic model directly and query it freely — meaning Row-Level Security has nothing left to enforce against them, because per Microsoft's own documentation, anything above Viewer bypasses RLS entirely.
The fix: both the Analysts and Viewers security groups in this project received the Viewer workspace role. The actual difference in what each group sees lives one layer up, inside the semantic model's RLS rules: Analysts get full transaction detail filtered to their territory, Viewers get aggregated summaries only. Two access models, deliberately layered, both depending on getting the workspace role right first.
The RLS roles themselves are created in Manage security roles inside the semantic model's web editor in Fabric. Three roles — Admin, Analyst, and Viewer — were created here with DAX filter expressions appropriate to each:
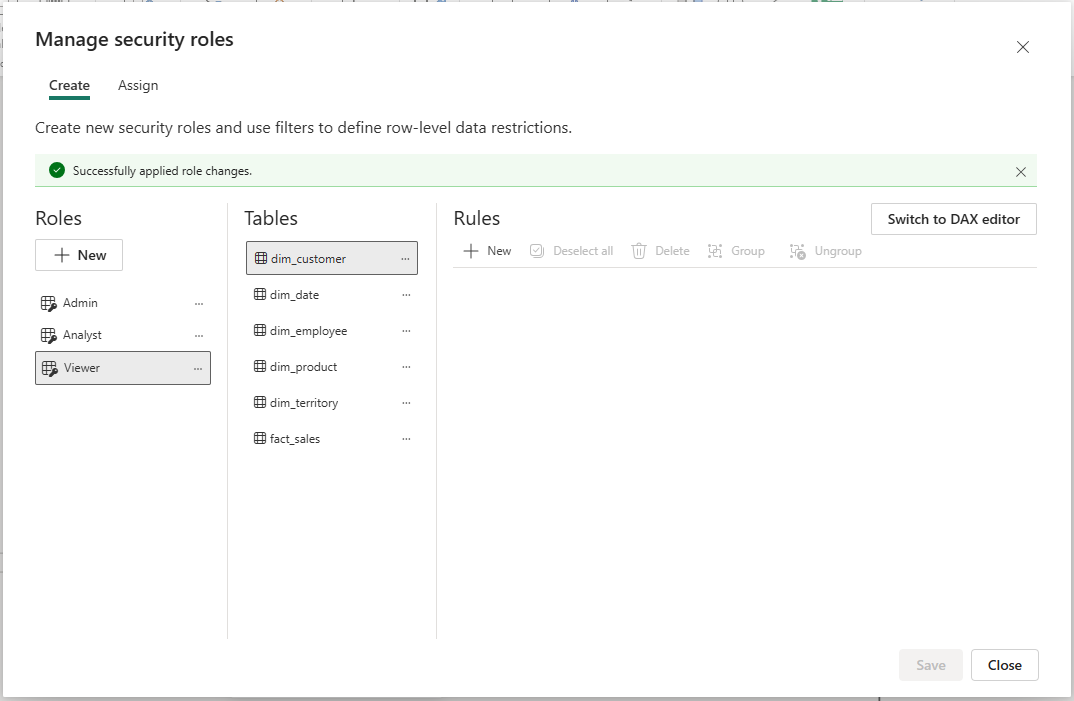
Manage security roles — Admin, Analyst, and Viewer created in the Fabric web model editor. The "Switch to DAX editor" button on the right is where territory-filter expressions are added per role. The success banner confirms role changes were saved.
OneLake security: closing the gap Power BI RLS leaves open
Power BI RLS only protects someone viewing a published report. It has zero effect on someone who connects directly to the Lakehouse via a notebook, the SQL analytics endpoint, or Excel. OneLake security closes that gap. From any Lakehouse item, "Manage OneLake security" lets you define custom roles scoped to specific tables — independent of anything built later in Power BI, and assignable to the same Entra security groups already governing the rest of the project. Two independent enforcement points protecting the same boundary: defense in depth, not a single point of failure.
The entry point is the Manage OneLake security button in the Lakehouse explorer's top ribbon:
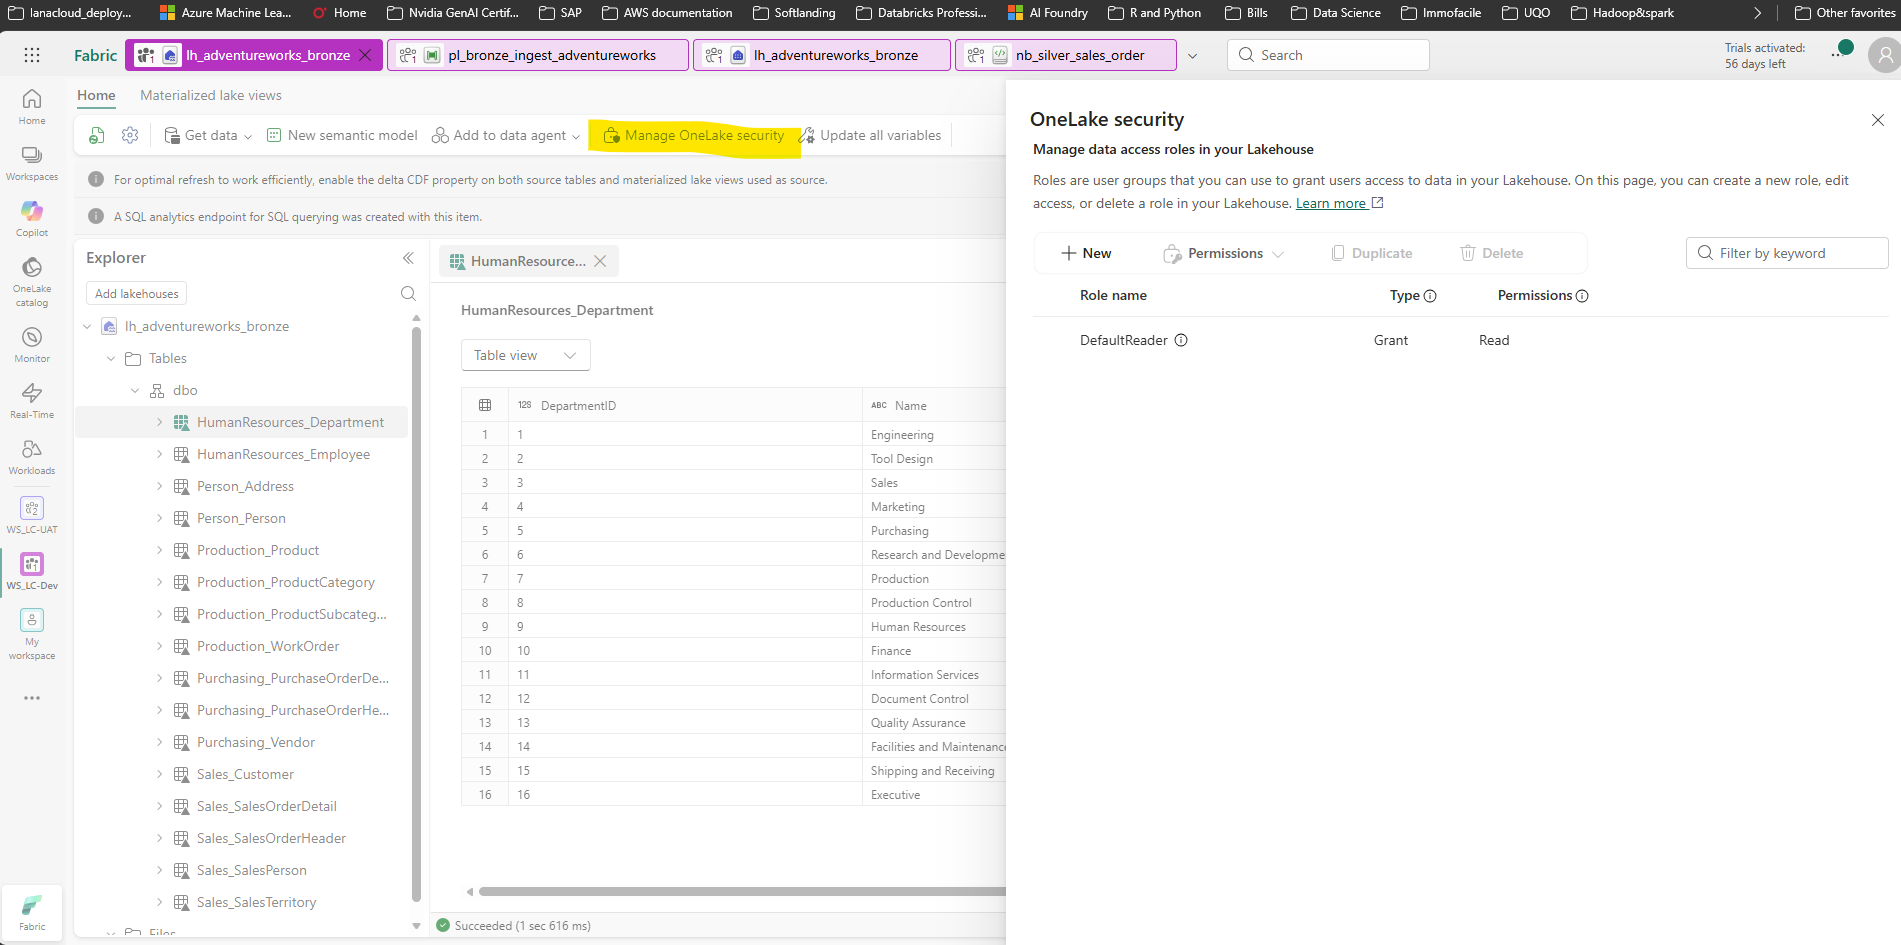
Lakehouse explorer — "Manage OneLake security" in the top ribbon opens the role management panel. This is a Lakehouse-level control that operates independently of any downstream semantic model or report.
Clicking it opens the OneLake security panel. From there, + New launches a three-step wizard:
Step 1 — Define the role name and type. The role is named AWPOCAnalysts, type Grant, with Read permission. Read is on by default; ReadWrite is only added when the role needs write access to Lakehouse data:
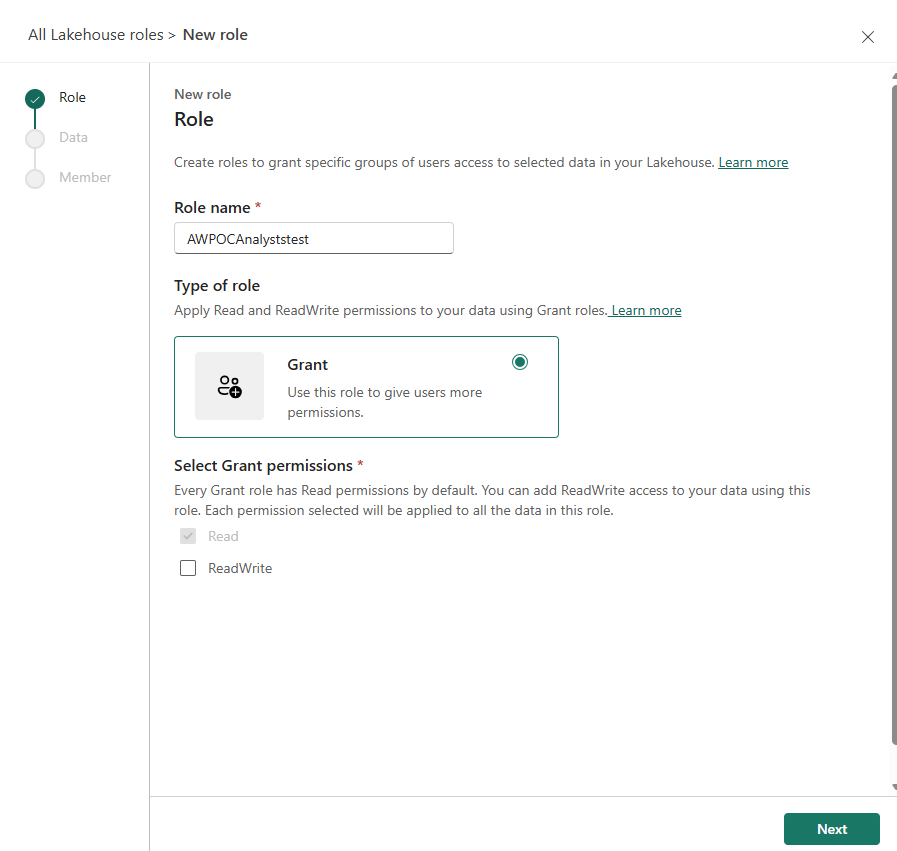
Role definition — Grant type with Read-only permissions. ReadWrite is explicitly unchecked — Analysts need to query the data, not modify it.
Step 2 — Select the data. Choosing "Selected data" rather than "All data" scopes the role to specific tables. For AWPOCAnalysts, only the five Sales schema tables are included — any other table in the Lakehouse is inaccessible to this role regardless of workspace assignment:
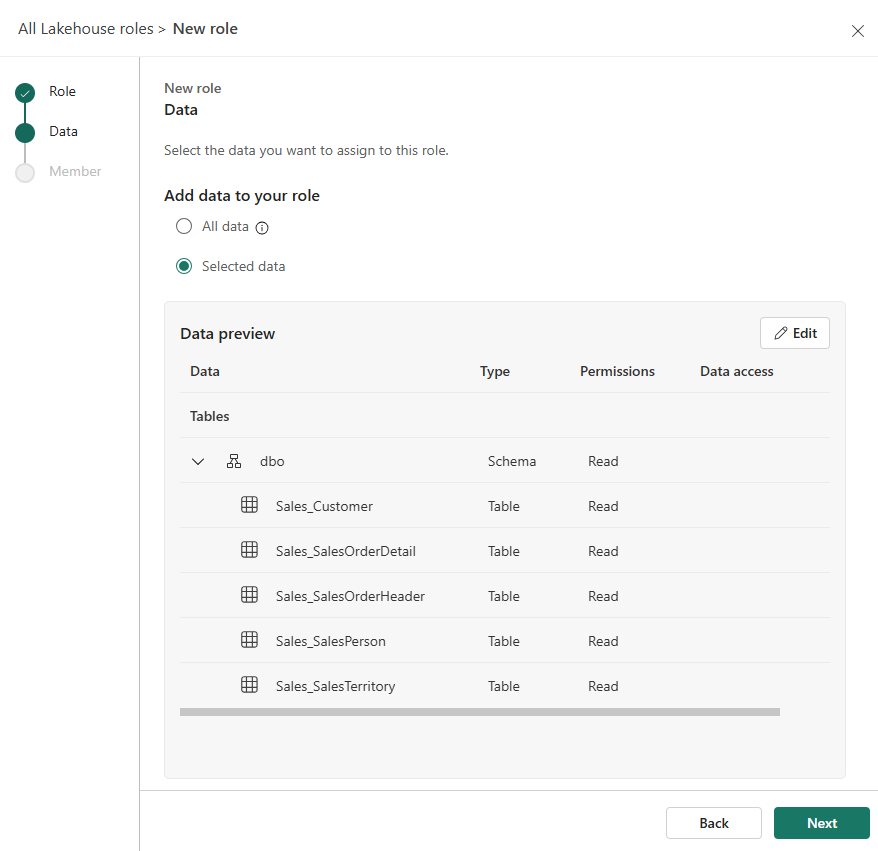
Data scope — five Sales tables assigned to this role. Tables not listed (HumanResources, Production, Purchasing) are inaccessible to role members at the OneLake layer — not just hidden from a report.
Step 3 — Add members. The Entra security group AW-POC-Analysts is added directly by email. Any future member added to the Entra group automatically inherits this OneLake role without any change to the Lakehouse configuration:
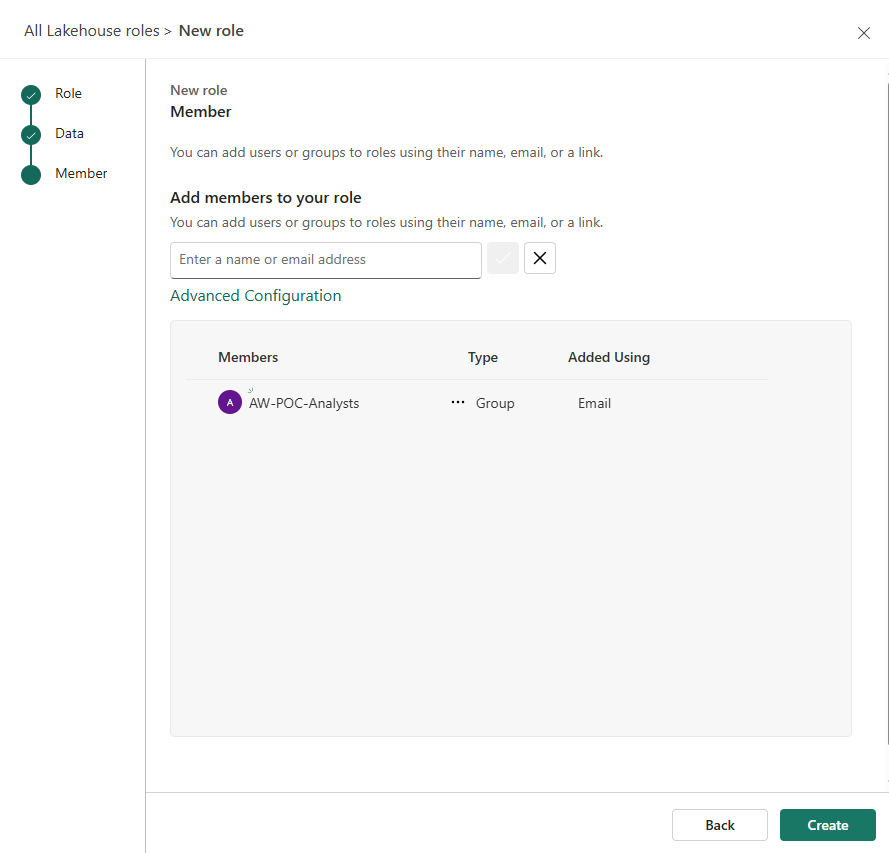
Member assignment — AW-POC-Analysts added at the group level. Membership changes in Entra propagate to OneLake access automatically, with no manual role update required.
After creation, the OneLake security panel shows both the custom role and the built-in DefaultReader:
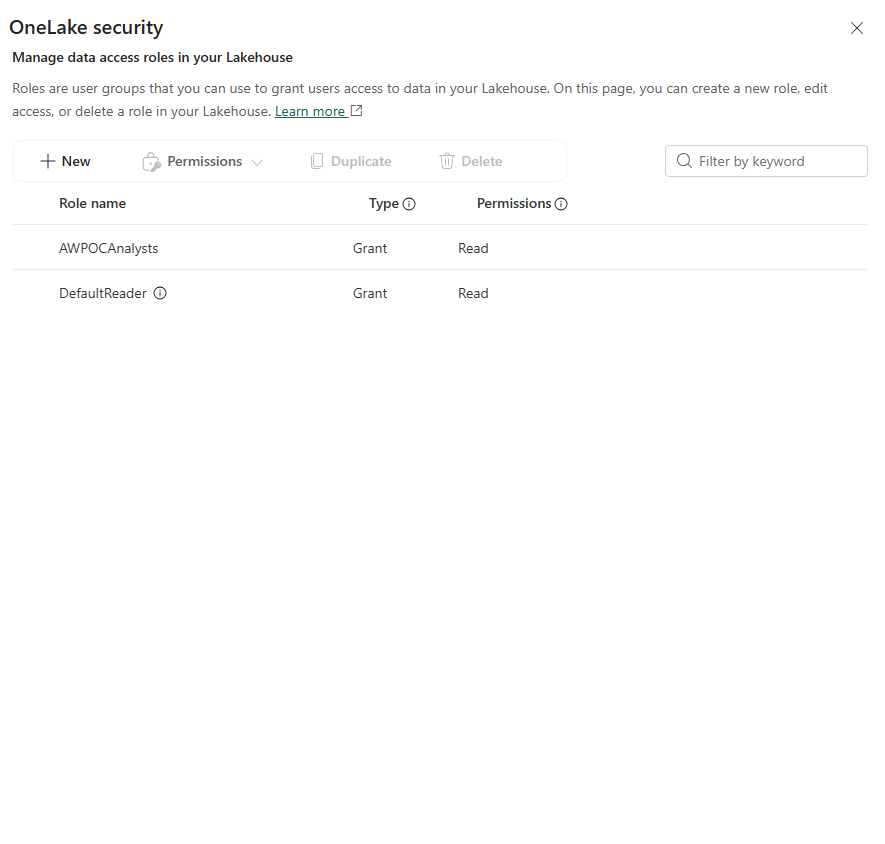
OneLake security roles — AWPOCAnalysts (scoped to Sales tables) alongside the built-in DefaultReader. The custom role's table restriction enforces at the storage layer, independently of whatever Power BI RLS does downstream.
True Object-Level Security still requires leaving the browser
Fabric's web modeling experience now handles most semantic modeling tasks that used to require Tabular Editor — table selection, relationships, even static RLS roles. OLS is the one piece that still does not fully live there. The web UI's "Hide in report view" toggle looks like OLS, but it only removes a column from the report-author's field list — the data stays fully queryable by anyone with model access through a new report, Excel, or the XMLA endpoint directly.
Real OLS enforces the restriction at the security-role level, making a column genuinely inaccessible regardless of how someone tries to query it, and currently requires a tool connected via the workspace's XMLA endpoint. Tabular Editor (the free version is sufficient) is the standard choice.
One architectural detail worth knowing when working with Direct Lake: Tabular Editor and DAX Studio both advertise automatic connection when launched from Power BI Desktop's External Tools ribbon, but that handoff fails silently for live-connected Direct Lake models — there is no local database for the tool to find, because Desktop is not hosting a copy of anything; it is a viewer pointed at a model that physically lives in the Fabric service. The fix is connecting directly to the workspace's XMLA connection link (powerbi://api.powerbi.com/v1.0/myorg/{workspace}) in "Tabular Server" mode rather than relying on auto-detect. As more models move to Direct Lake, this is the practical skill that replaces the old "launch from Desktop and it just connects" workflow.
Once connected, Tabular Editor exposes the full Object Level Security configuration under each column's Translations, Perspectives, Security section in the properties panel. The example below shows dim_employee[BirthDate] — a column that should be inaccessible to Analysts but readable by Admins. The Analyst role is selected in the Object Level Security list and its value is set to None (restricted), while Admin stays Default (inherited) and Viewer also stays Default:
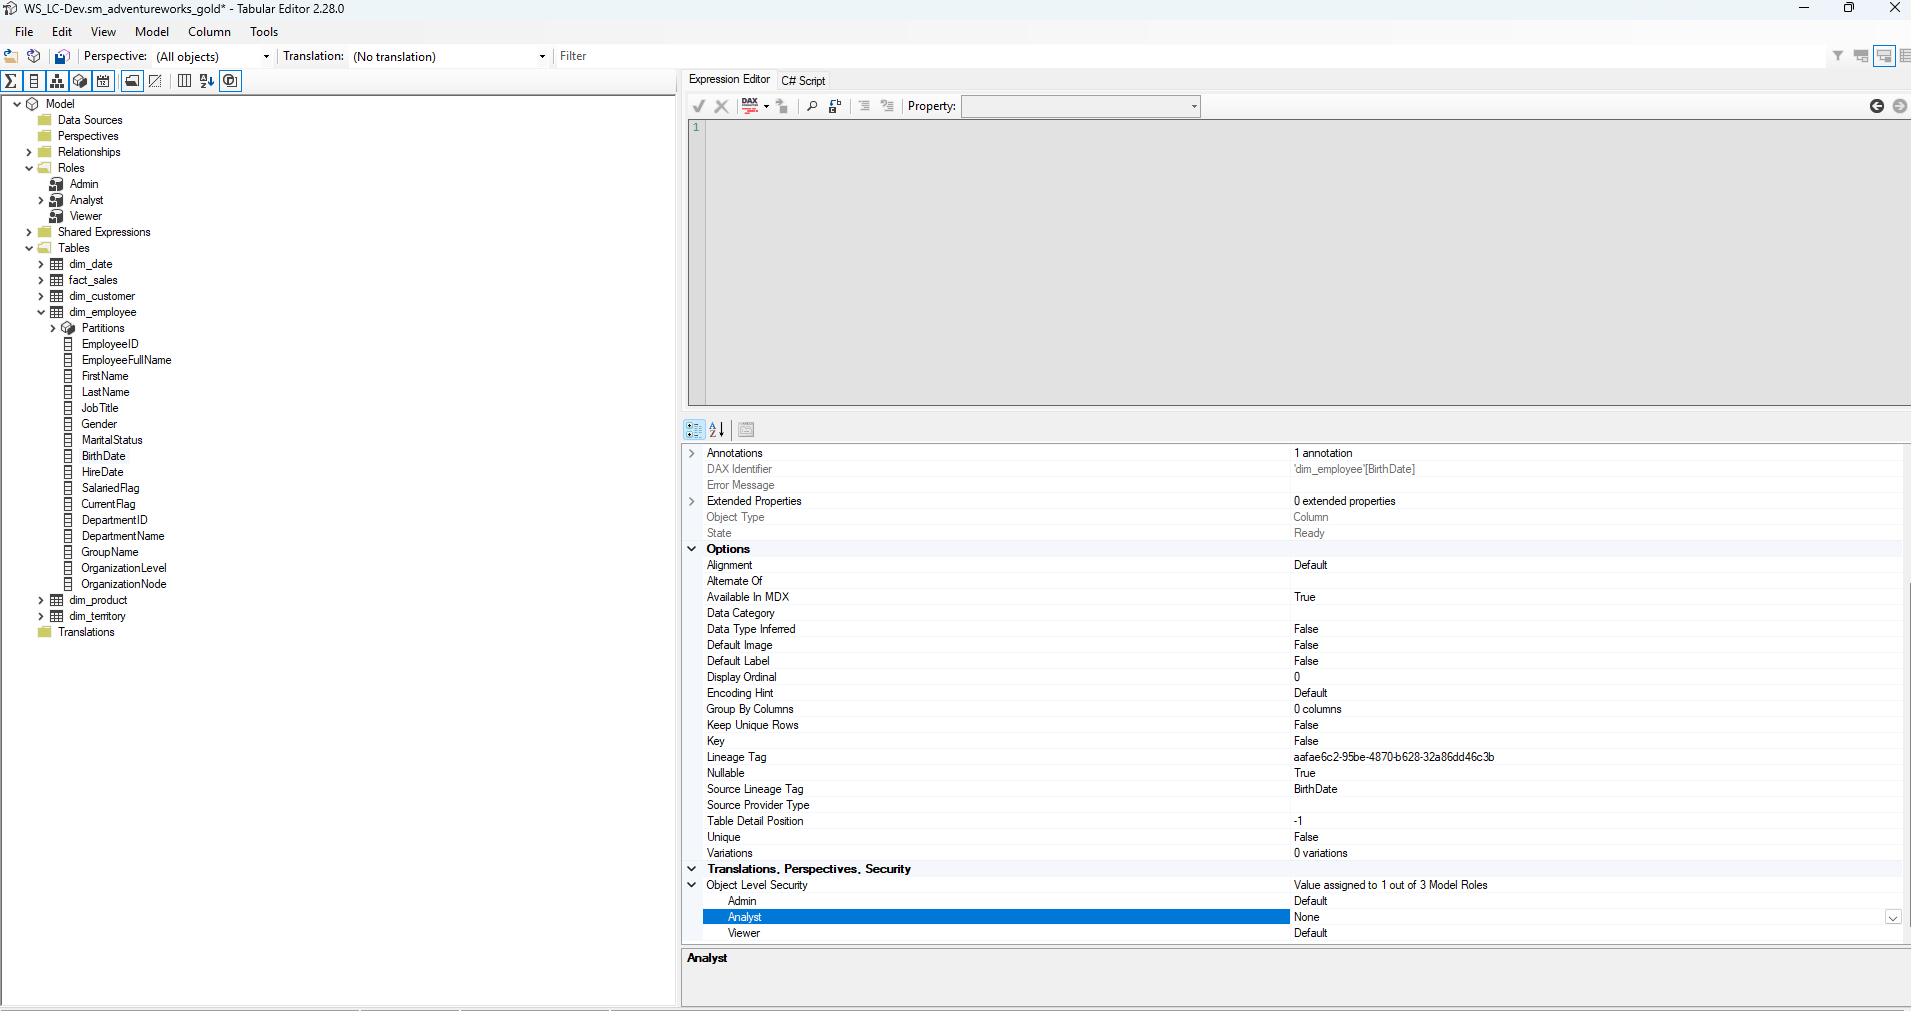
Tabular Editor — dim_employee[BirthDate] with Object Level Security: Analyst set to None (genuinely inaccessible), Admin and Viewer set to Default (inherited). This column will not appear for anyone in the Analyst role regardless of how they query the model — report, Excel, or XMLA endpoint.
Setting None on a column makes it genuinely inaccessible at the security-role level — not merely hidden from the field list. A member of the Analyst role querying the model directly through the XMLA endpoint will receive an error rather than a value, which is the behaviour the "Hide in report view" toggle does not produce.
Proving RLS works — with a real identity, not a placeholder
Power BI Desktop's "View as Roles" stays permanently grayed out for Direct Lake live connections, and there is no direct equivalent in the Fabric web UI. The actual feature lives in DAX Studio's Advanced → View As dialog, which supports impersonating a role, a user, or both.
The first real test failed in an instructive way: the mapping table had been seeded with invented placeholder UPNs, and DAX Studio rejected the impersonation outright — "the database doesn't exist, or you are not authorized to access it." Impersonating an identity for RLS evaluation requires that identity to actually resolve against Entra; a UPN string sitting in a Delta table is just text until Entra confirms a real account behind it. Switching to a real account mapped to the Northwest territory worked immediately and returned exactly one row — Northwest, and only Northwest. That is the difference between "the logic should work" and actual, observed proof.
Part 3 — Building the Executive Report
Before starting this part: The Gold Lakehouse (lh_adventureworks_gold) must be populated with all dimension and fact tables. The sm_adventureworks_gold Direct Lake semantic model must exist — if it does not, create it via New item → Semantic model in the Fabric workspace, selecting the Gold Lakehouse as the source. Security groups from Part 2 must be in place before you publish the report, because the RLS roles reference them.
The executive report has three pages — Executive Summary, Sales Detail, and Product Detail — all served from the same Direct Lake model. Build them in order; the drillthrough pages depend on the Executive Summary page's fields.
Step 1 — Build the Executive Summary page
The landing page contains four KPI cards and three chart visuals:
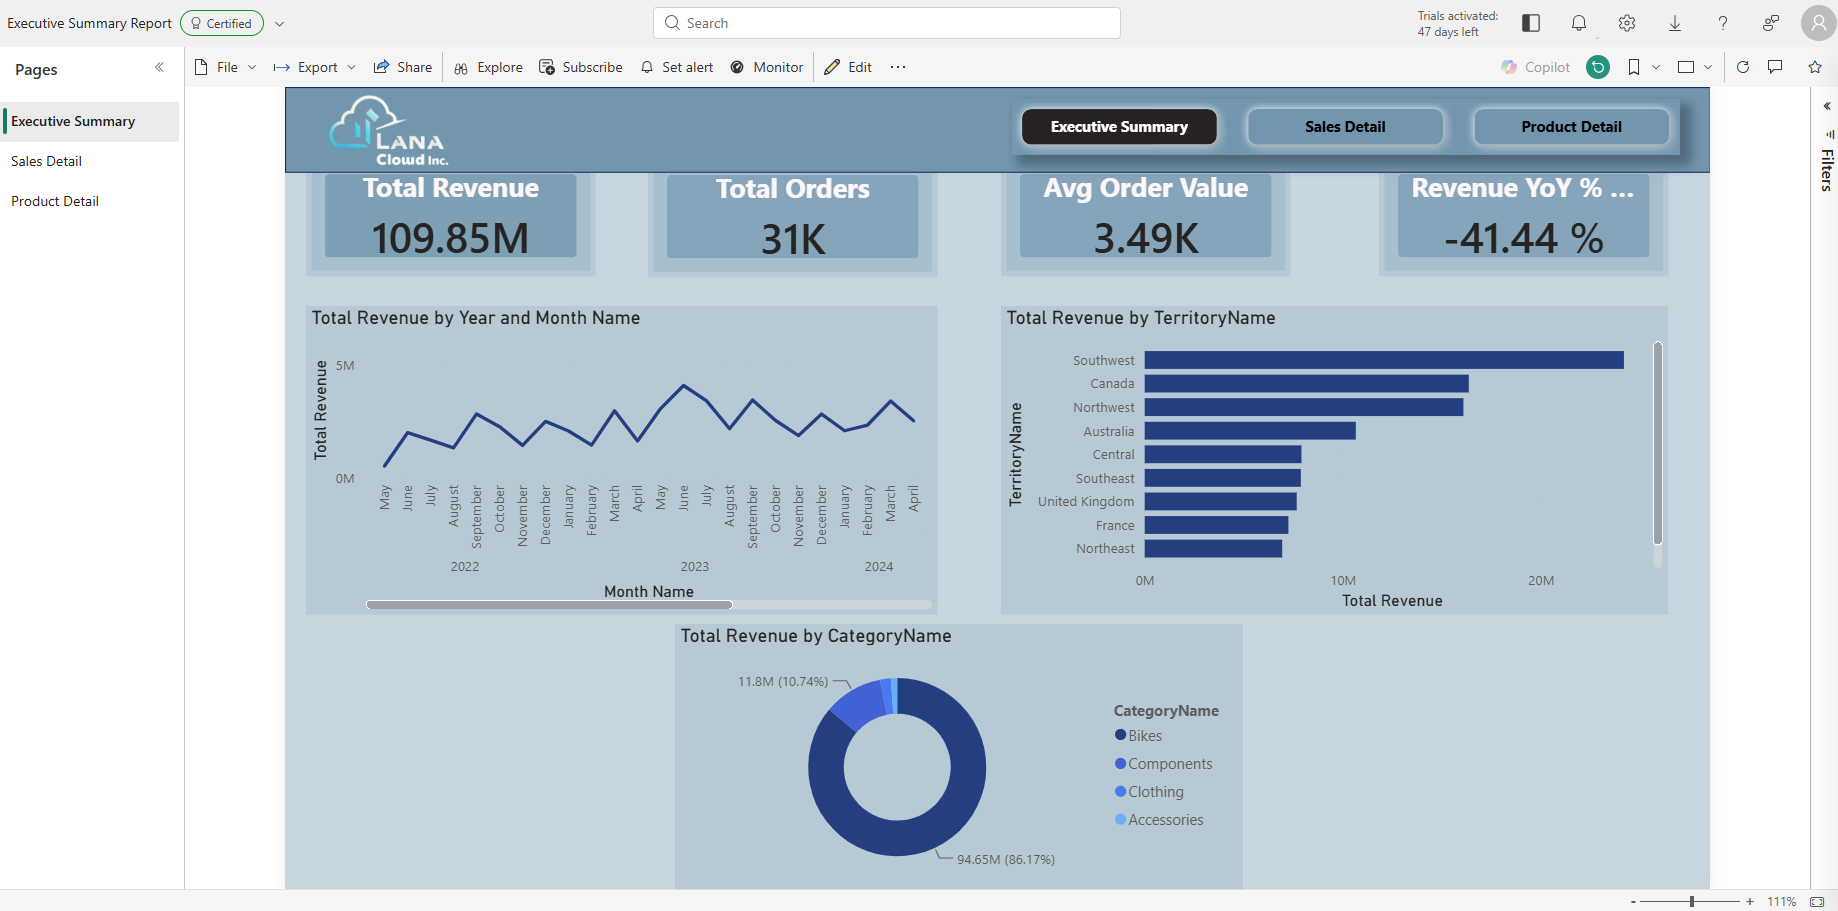
Executive Summary — four KPI cards and three charts against the full AdventureWorks dataset (109.85M total revenue, 31K orders). The Certified badge is applied in Part 4 after the governance workflow.
KPI card measures:
| Card | DAX | Format |
|---|---|---|
| Total Revenue | Total Revenue = SUM(fact_sales[LineTotal]) |
$M |
| Total Orders | Total Orders = DISTINCTCOUNT(fact_sales[SalesOrderID]) |
K |
| Avg Order Value | Avg Order Value = DIVIDE([Total Revenue], [Total Orders]) |
$ |
| Revenue YoY % | Revenue YoY % = DIVIDE([Total Revenue] - CALCULATE([Total Revenue], SAMEPERIODLASTYEAR(dim_date[Date])), CALCULATE([Total Revenue], SAMEPERIODLASTYEAR(dim_date[Date]))) |
% |
Chart visuals:
- Total Revenue by Year and Month Name — Line chart. X-axis:
dim_date[MonthName], Y-axis:[Total Revenue]. ⚠️ SetMonthName's Sort by Column todim_date[MonthNumber]in the model and set the visual axis sort to MonthName Ascending — without both, the axis silently sorts by revenue value and produces a misleading trend line. - Total Revenue by TerritoryName — Horizontal bar. Y-axis:
dim_territory[TerritoryName], X-axis:[Total Revenue]. - Total Revenue by CategoryName — Donut chart. Legend:
dim_product[CategoryName], Values:[Total Revenue].
Step 2 — Build the Sales Detail drillthrough page
The Sales Detail page is a drillthrough destination — users reach it by right-clicking any data point on the Executive Summary and selecting Drill through → Sales Detail:
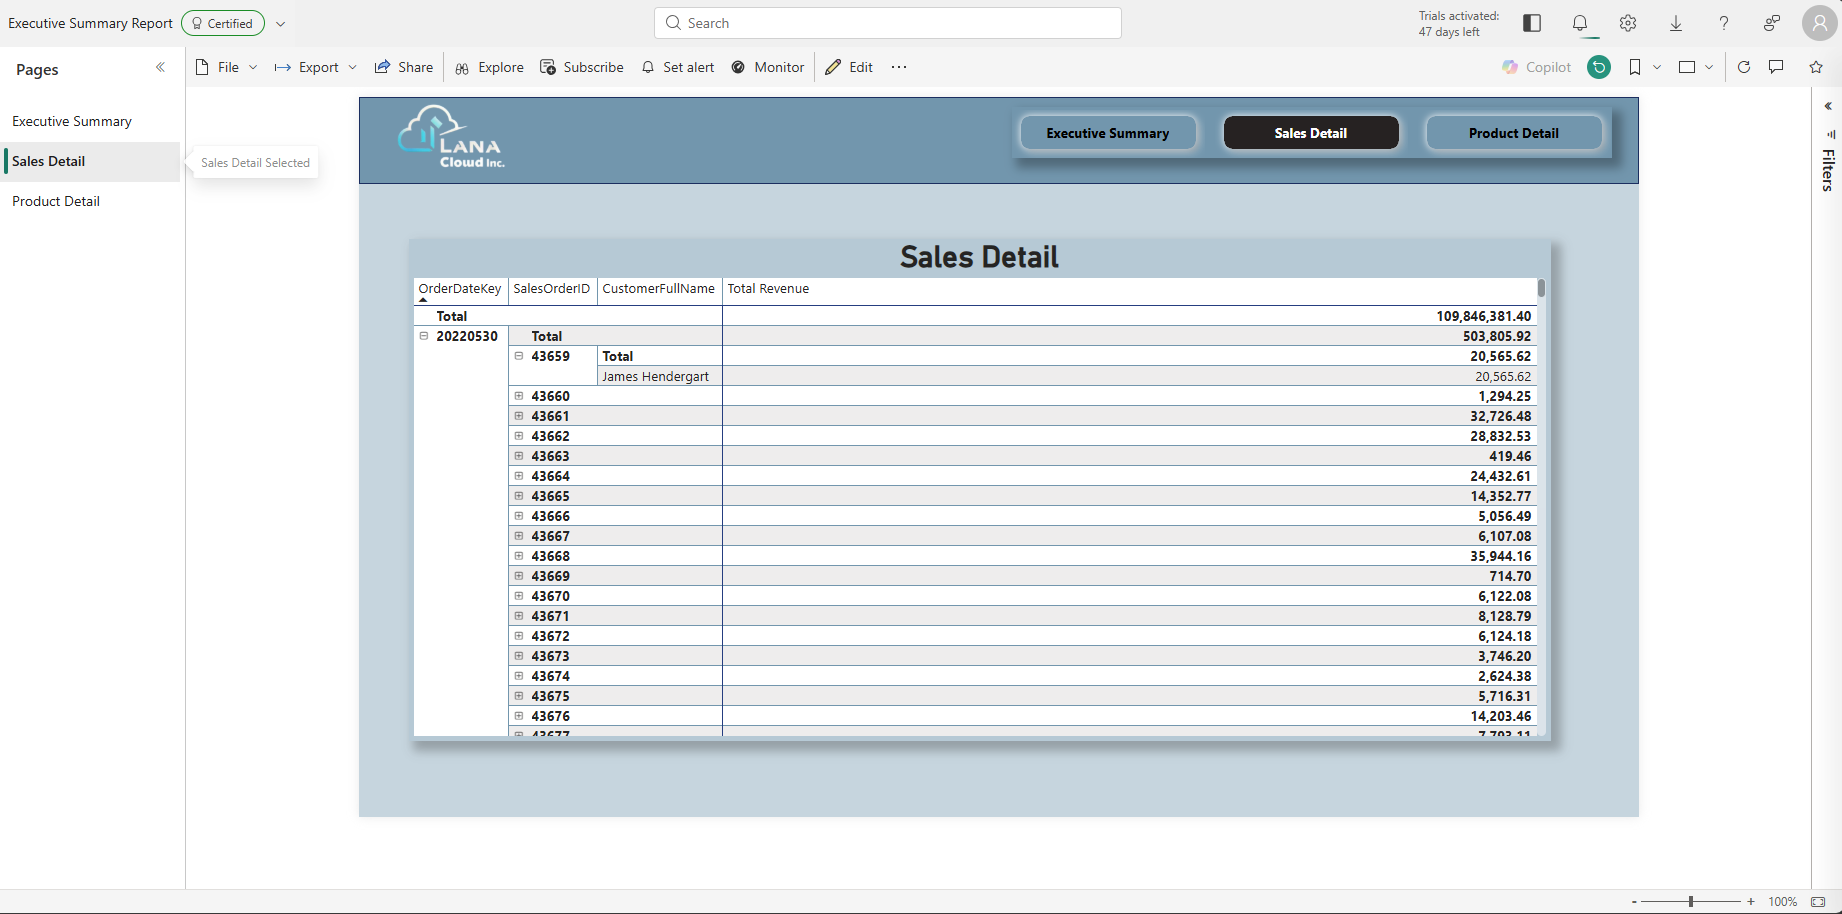
Sales Detail page — matrix visual with OrderDateKey → SalesOrderID → CustomerFullName hierarchy. The grand total (109,846,381.40) must match the Executive Summary's Total Revenue exactly — if it doesn't, check the grain trap below.
Matrix visual configuration:
| Setting | Value |
|---|---|
| Rows | dim_date[OrderDateKey] → fact_sales[SalesOrderID] → dim_customer[CustomerFullName] |
| Values | [Total Revenue] measure |
| Drillthrough field | dim_date[OrderDateKey] (add to the Drillthrough well in the Visualizations pane) |
⚠️ Grain trap: If the matrix total is approximately 27× the expected revenue, you used
fact_sales[TotalDue]instead of[Total Revenue].TotalDueis stored at order-grain;fact_salesis at line-item-grain — summingTotalDuemultiplies every order's total by its line-item count. Always use the[Total Revenue]measure (built onLineTotal) for any revenue aggregation.
Step 3 — Build the Product Detail drillthrough page
The Product Detail page shows revenue by individual product and subcategory, reachable by right-clicking any slice of the Executive Summary donut chart:
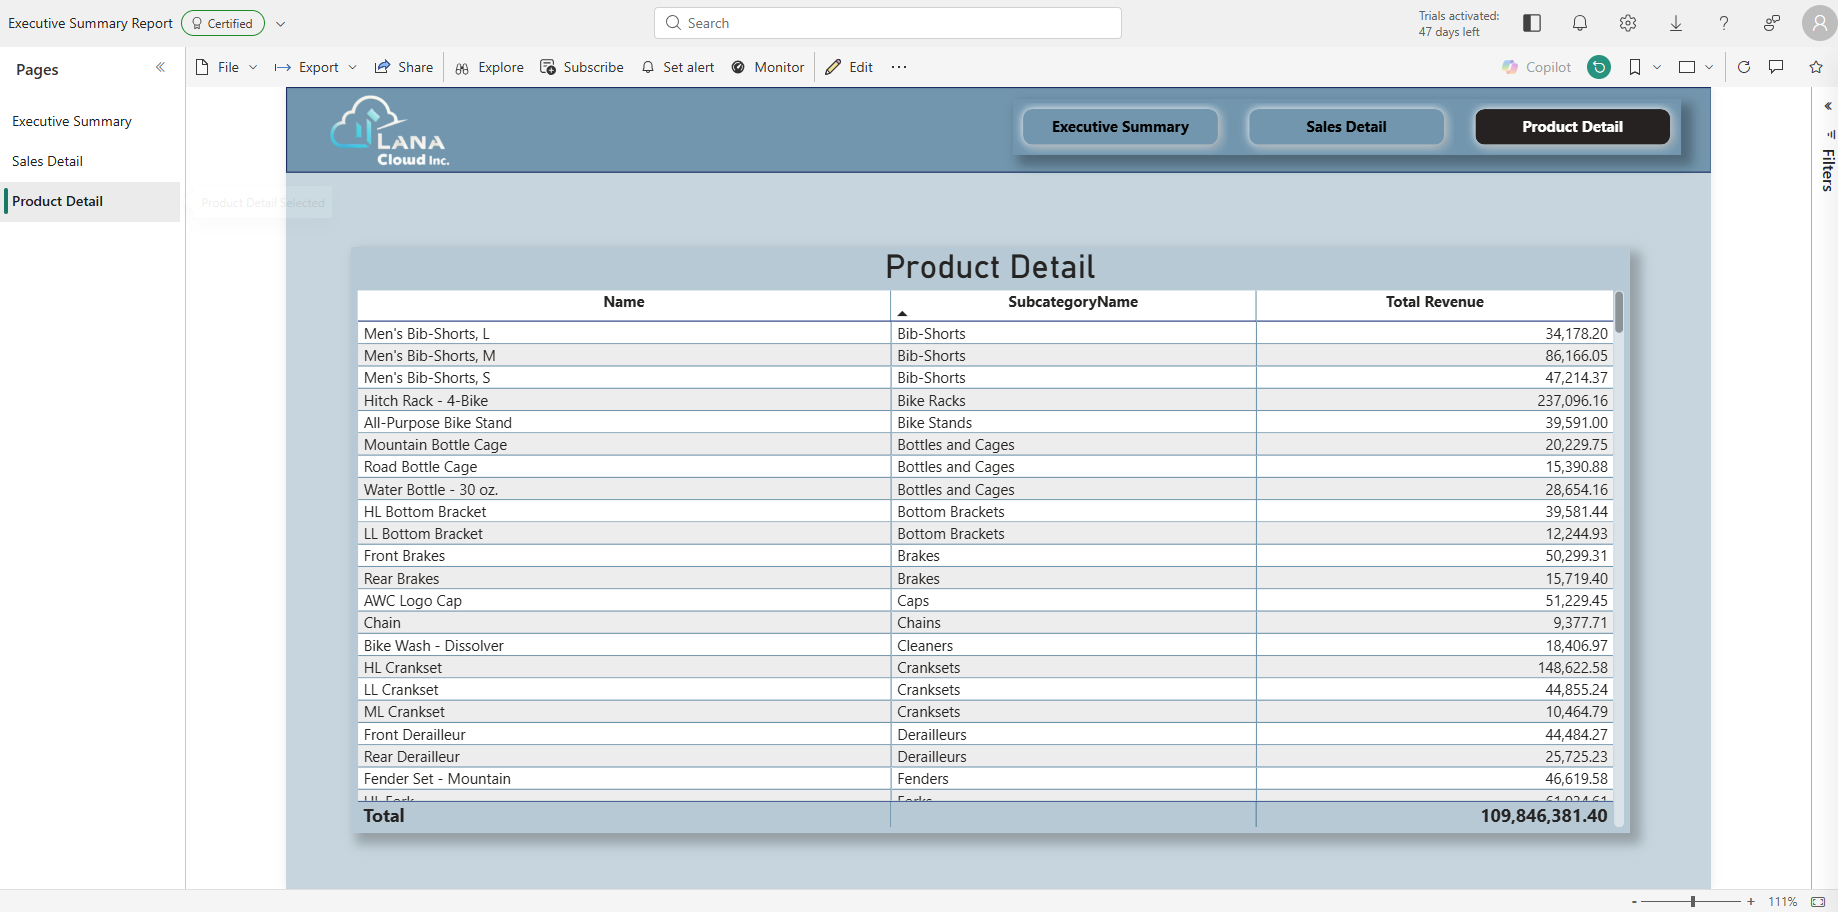
Product Detail page — table visual with product Name, SubcategoryName, and Total Revenue, drillthrough-connected to CategoryName from the Executive Summary donut chart.
Table visual configuration:
| Column | Source |
|---|---|
| Name | dim_product[Name] |
| SubcategoryName | dim_product[SubcategoryName] |
| Total Revenue | [Total Revenue] measure |
Set the Drillthrough field to dim_product[CategoryName] so the page is reachable from the Executive Summary donut.
Step 4 — Publish and verify
Once all three pages are built in the Fabric browser editor:
- Save the report — it is already live in Fabric; there is no separate publish step for reports built natively in the service.
- Confirm the grand totals on Sales Detail and Product Detail match Executive Summary's
[Total Revenue](109,846,381.40 in this dataset). - Verify access for
AW-POC-Analystsmembers under Share → Manage permissions. - Do not apply the Certified badge yet — that is Part 4.
Four things to watch for
1. Month sort order requires two separate settings. Set dim_date[MonthName]'s Sort by Column to dim_date[MonthNumber] at the model level in the semantic model's web editor. Then, in the visual's Format pane, set the X-axis sort to MonthName Ascending. Missing either step gives a trend line that looks plausible but is structurally wrong.
2. View as Roles is permanently grayed out for Direct Lake. Use DAX Studio's Advanced → View As for all RLS testing — covered in Part 2. This is not a bug you can work around in Power BI Desktop.
3. Stray page filters override drillthrough defaults silently. If a drillthrough page shows unexpected filtered data when navigated to directly, open the Filters pane → Filters on this page section and check for filters that do not belong there. They are not visible in the visual-level filter pane.
4. You cannot download a Direct Lake report as .pbix. This is a confirmed platform constraint — Direct Lake content lives in the service. Build, iterate, and publish entirely in the Fabric browser.
Part 4 — Certification, Lineage, and a Real Permissions Investigation
Before starting this part: The executive report must be published in Fabric (Part 3 complete). You need tenant admin access to the Fabric Admin portal to enable the Certification setting. The certifying account must be a direct member of the AW-POC-Admins Entra security group — workspace Admin role alone is not sufficient.
Closing the governance loop meant three more phases, each demonstrating a different facet of maturity rather than a checkbox.
Certification: the two-layer admin gate
Certification in Fabric is gated at two independent levels. First, a tenant admin must enable it — and the scope matters: enabling for "The entire organization" means any user can certify anything, which defeats the purpose. Scoping to a specific security group means only members of that group can apply the certification badge:
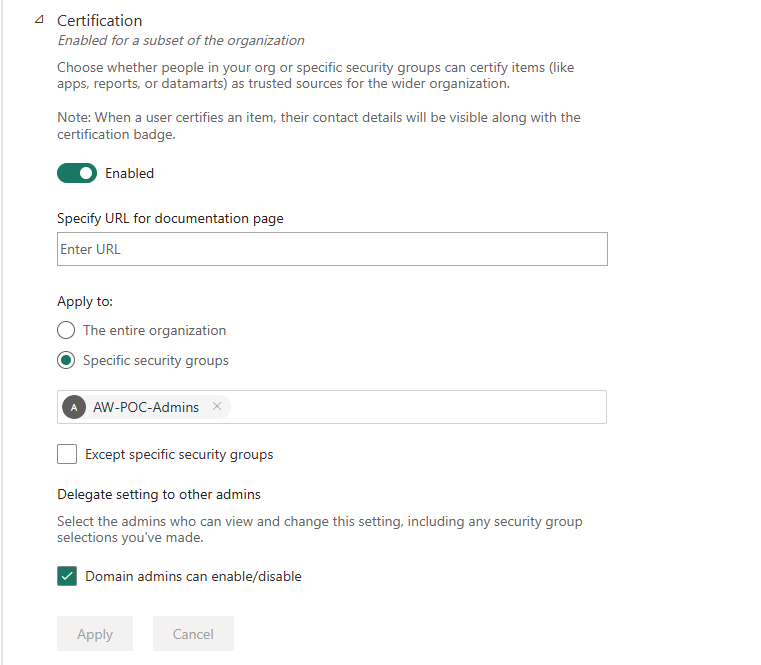
Admin portal Certification setting — enabled for AW-POC-Admins only. Without this, the "Certified" option simply does not appear in the endorsement UI regardless of workspace role.
Second, the certifying account must be a direct member of the authorized security group — not just a workspace Admin or Owner. Workspace role assignment does not imply security group membership. Once both conditions were met, the endorsement panel on the semantic model offered "Certified" as a selectable option:
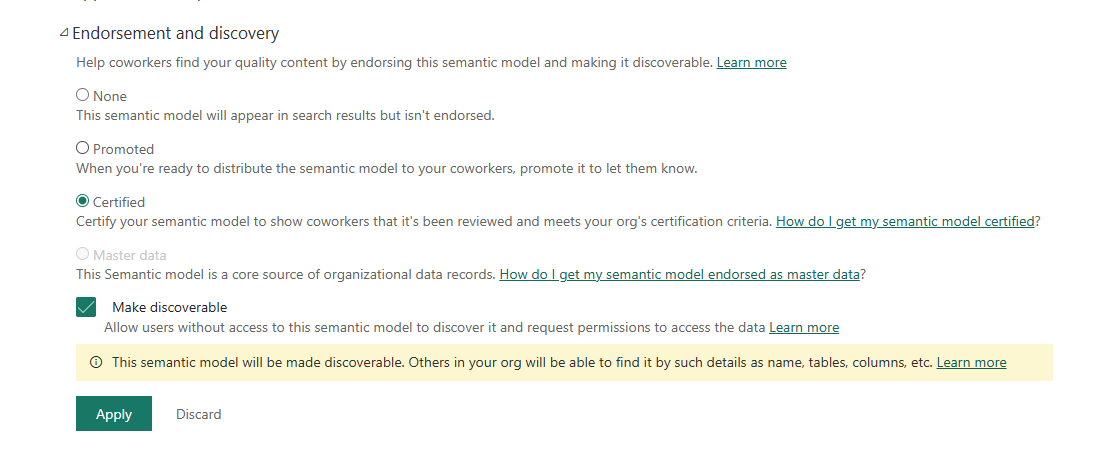
Endorsement and discovery — Certified selected, Make discoverable checked. The discoverability warning is intentional: this dataset is meant to be findable by analysts across the tenant as the authoritative source.
With certification applied, the semantic model shows the Certified badge in the workspace's folder view — timestamped and attributed to the certifying account:
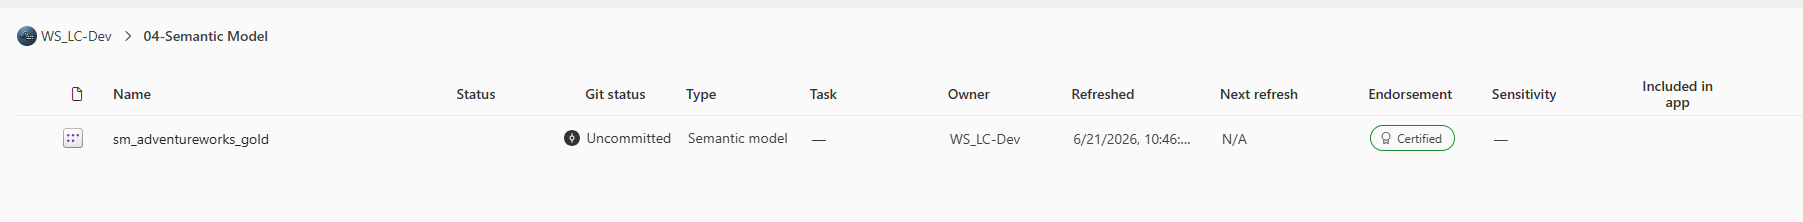
sm_adventureworks_gold — Certified badge visible in the workspace folder view. Git status shows Uncommitted, which is expected for a Direct Lake model before the Git export workaround described in Part 5.
The executive report was certified separately via its own settings panel — certification does not cascade from the semantic model to dependent reports automatically:
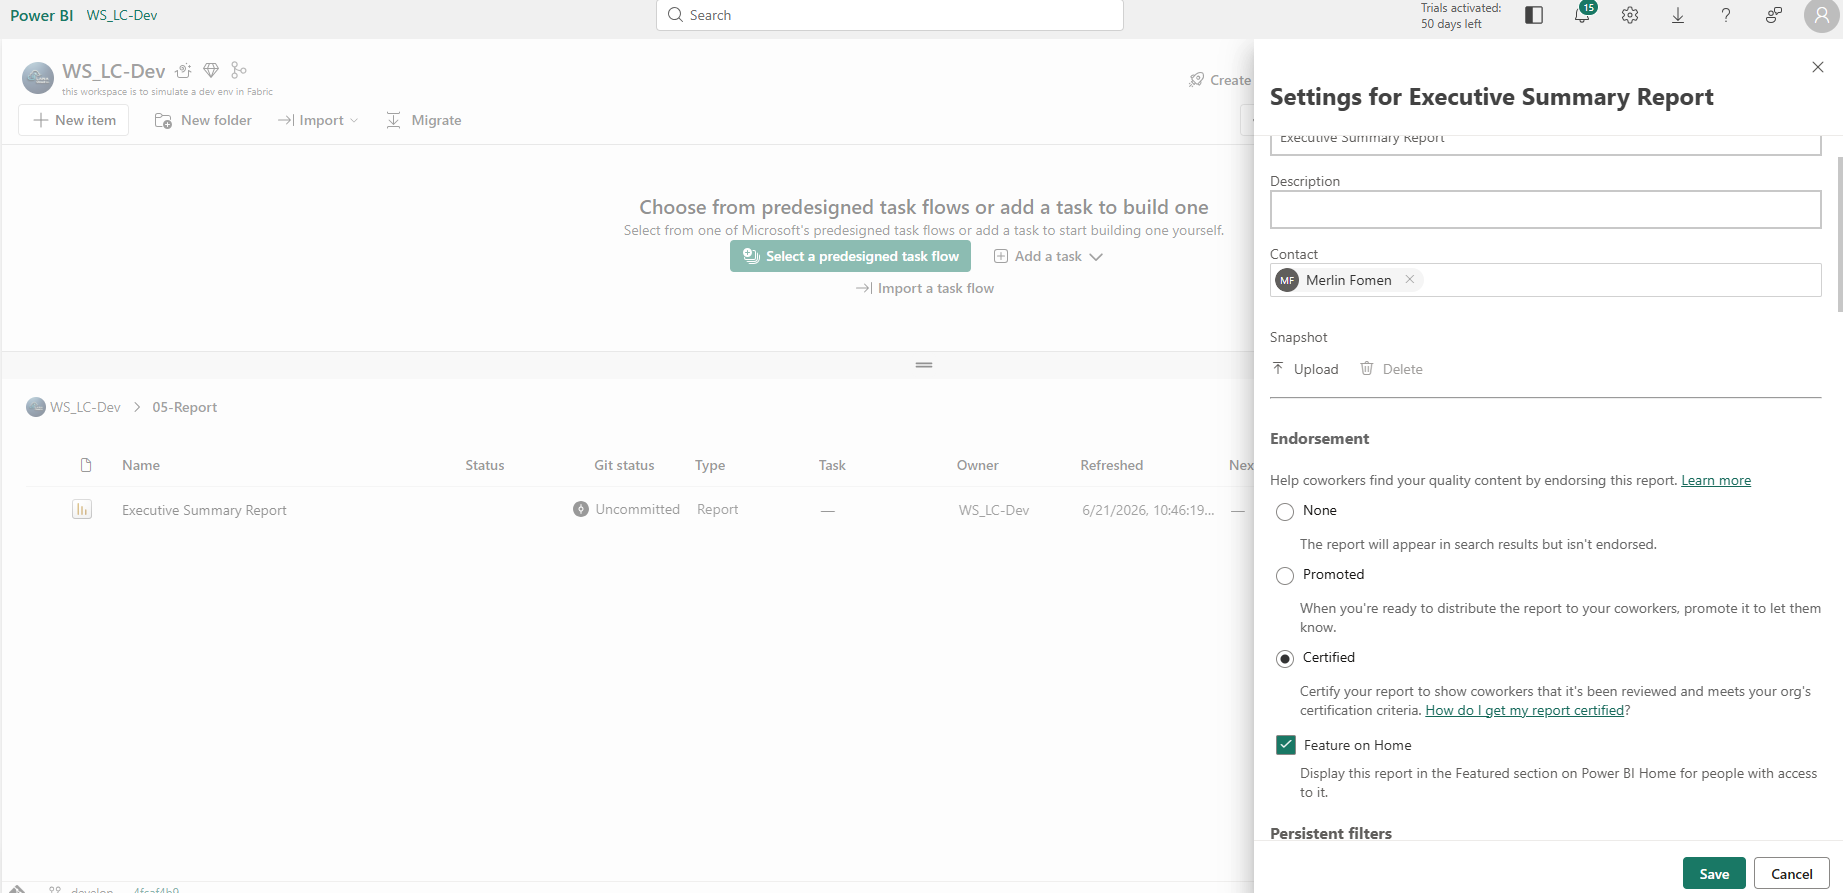
Executive Summary Report settings — Certified + Feature on Home. "Feature on Home" surfaces the report in the Featured section on Power BI Home for users with access — a lightweight distribution step that requires no app publication.
Lineage View and Impact Analysis
With both items certified, the Lineage view in WS_LC-Dev confirmed the full chain from storage to consumer:
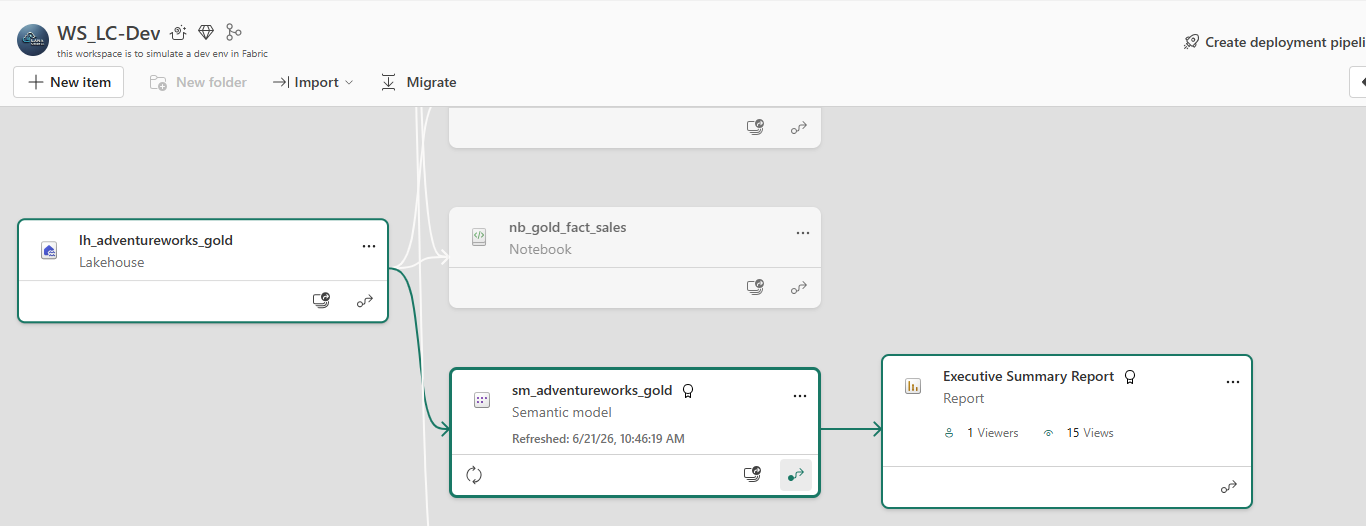
Lineage view — Gold Lakehouse → nb_gold_fact_sales notebook → sm_adventureworks_gold (Certified) → Executive Summary Report. The report shows 1 Viewer and 15 Views — confirming the RLS identity test from Part 2 generated real tracked usage, not just local preview activity.
An unplanned detour into Impact Analysis turned out to be the more genuinely useful artifact of the two. Clicking "Impacted by this Lakehouse" on lh_adventureworks_silver returned a precise, enumerated answer rather than requiring inference:
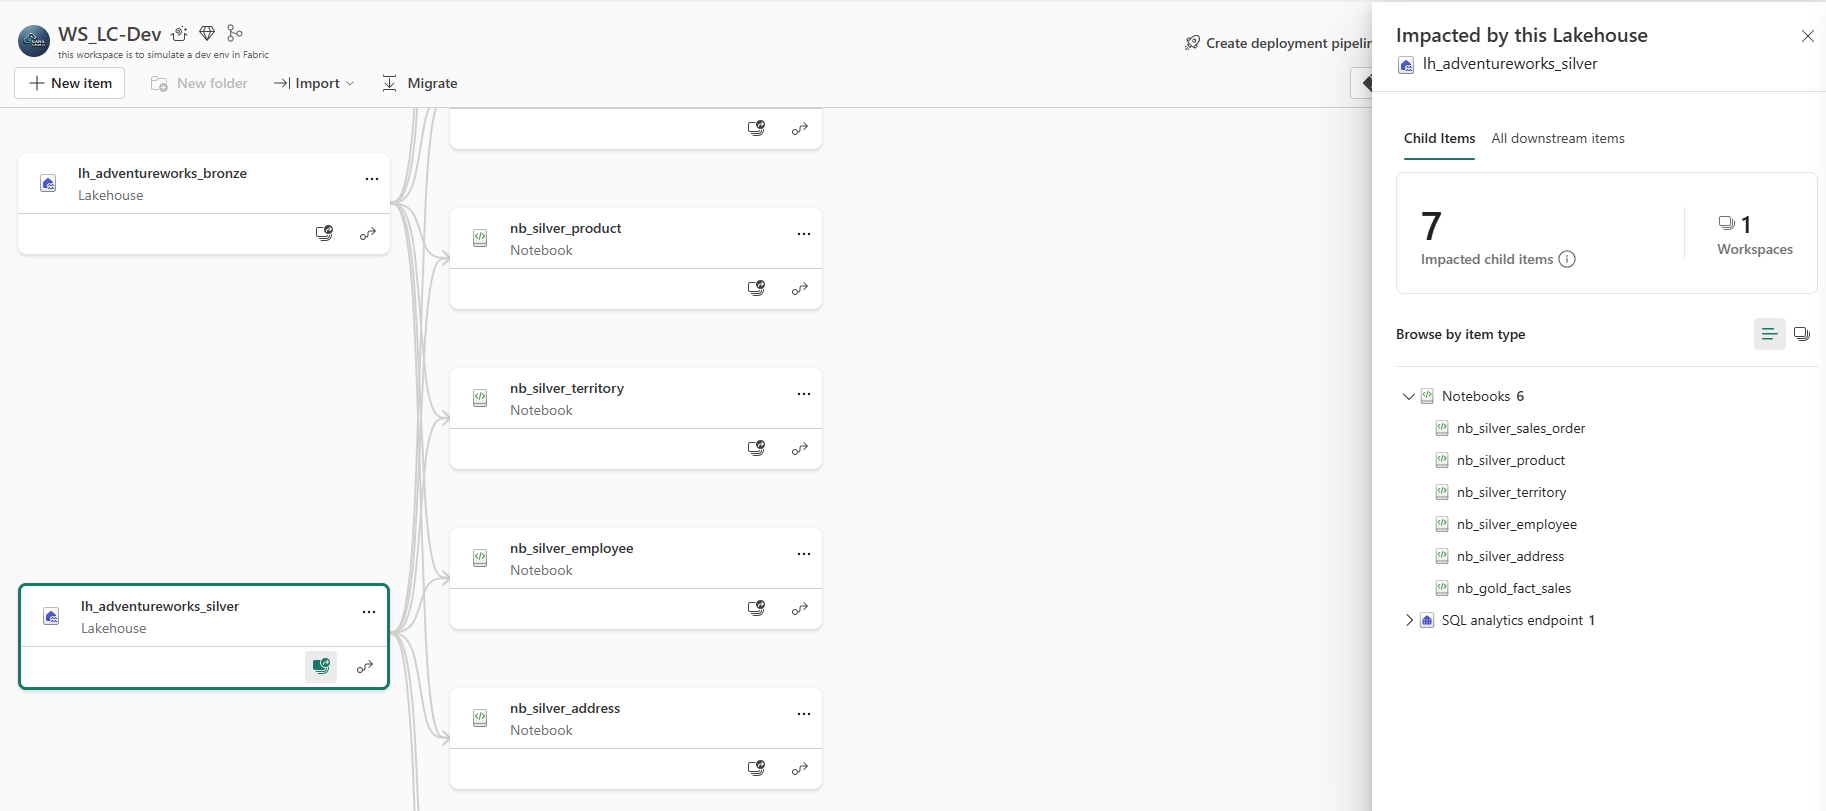
Impact Analysis — lh_adventureworks_silver: 7 impacted child items across 1 workspace. Six notebooks depend on it directly (including nb_gold_fact_sales which reads from Silver), plus the auto-provisioned SQL analytics endpoint. This is the answer to "what breaks if I touch this Lakehouse" without having to trace every dependency manually.
Asking "what breaks if I touch this Silver Lakehouse" returned 7 downstream items across 6 notebooks and 1 SQL analytics endpoint — a specific, actionable answer, not a guess. Lineage shows you the chain; Impact Analysis tells you the blast radius of a change before you make it.
Audit Logging: a Permissions Investigation
Microsoft Purview's Audit search is the authoritative log for Fabric and Power BI activity in the tenant. Getting to a working first search required resolving a non-obvious permissions split.
The initial search attempt failed identically across every date range and filter combination — a constant failure regardless of what was varied, which points at something structural rather than a bad input. The search UI looked correct; the results were simply absent:
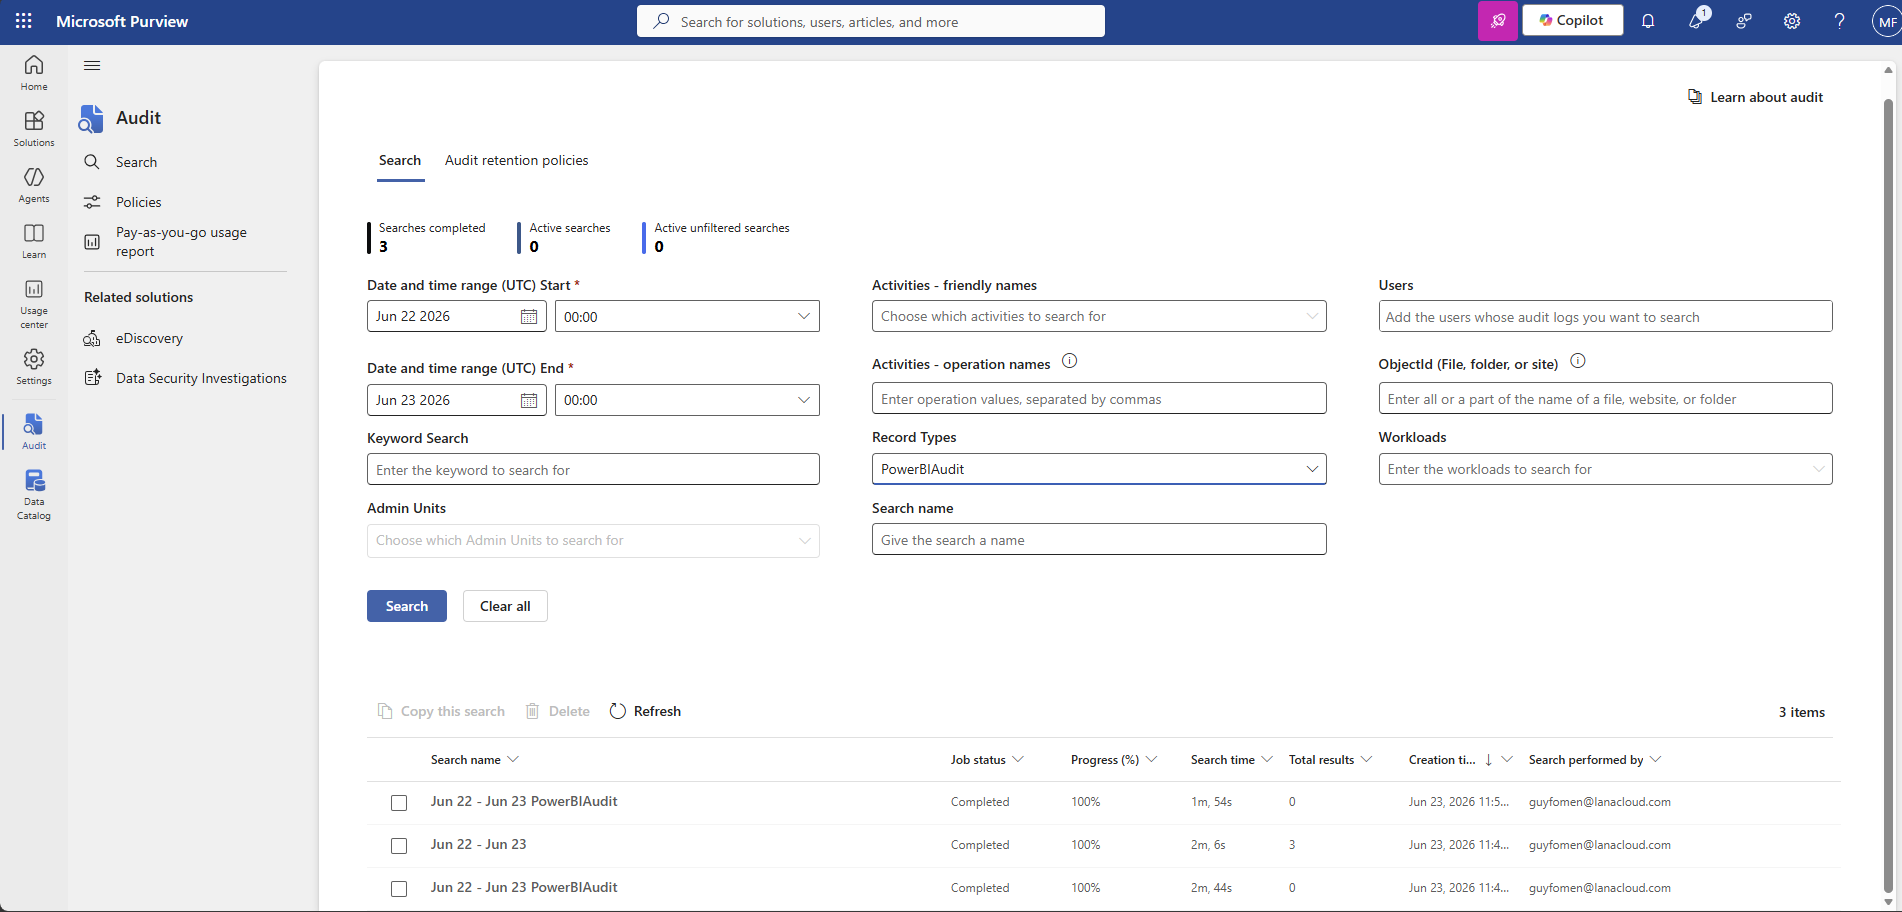
Purview Audit search — three search attempts across the same Jun 22-23 window. The pattern (0 → 3 → 0 results) tells the story: the middle search was run after adding the Audit Reader role, the outer two show what the search returns without it.
The cause: holding broad admin role groups (Organization Management, Purview Administrators) does not include audit search rights in Microsoft's current permission model. Audit access is split into its own dedicated Audit Reader / Audit Manager role groups. The fix was adding the account directly to Audit Reader in Purview's Role groups settings:
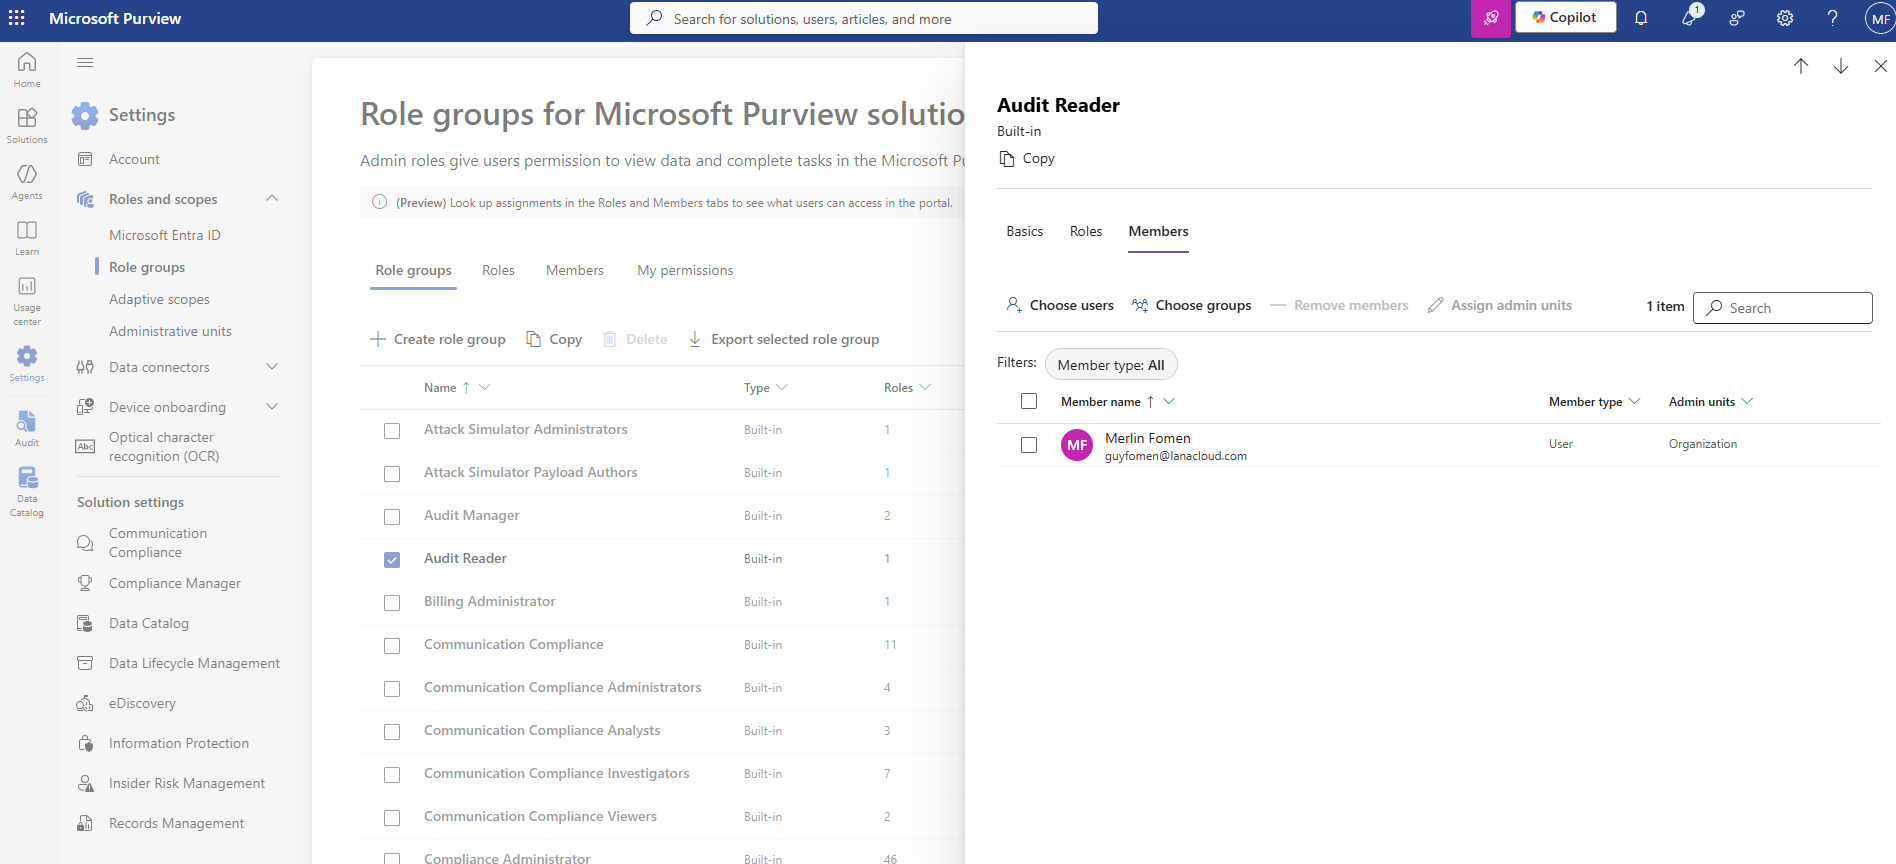
Purview Role groups — Audit Reader, Members tab. Merlin Fomen added directly as a User member. This is a Purview-level permission, separate from Entra groups and Fabric workspace roles.
The full permissions picture after resolving the audit access issue is visible on the My permissions tab in Purview Role groups:
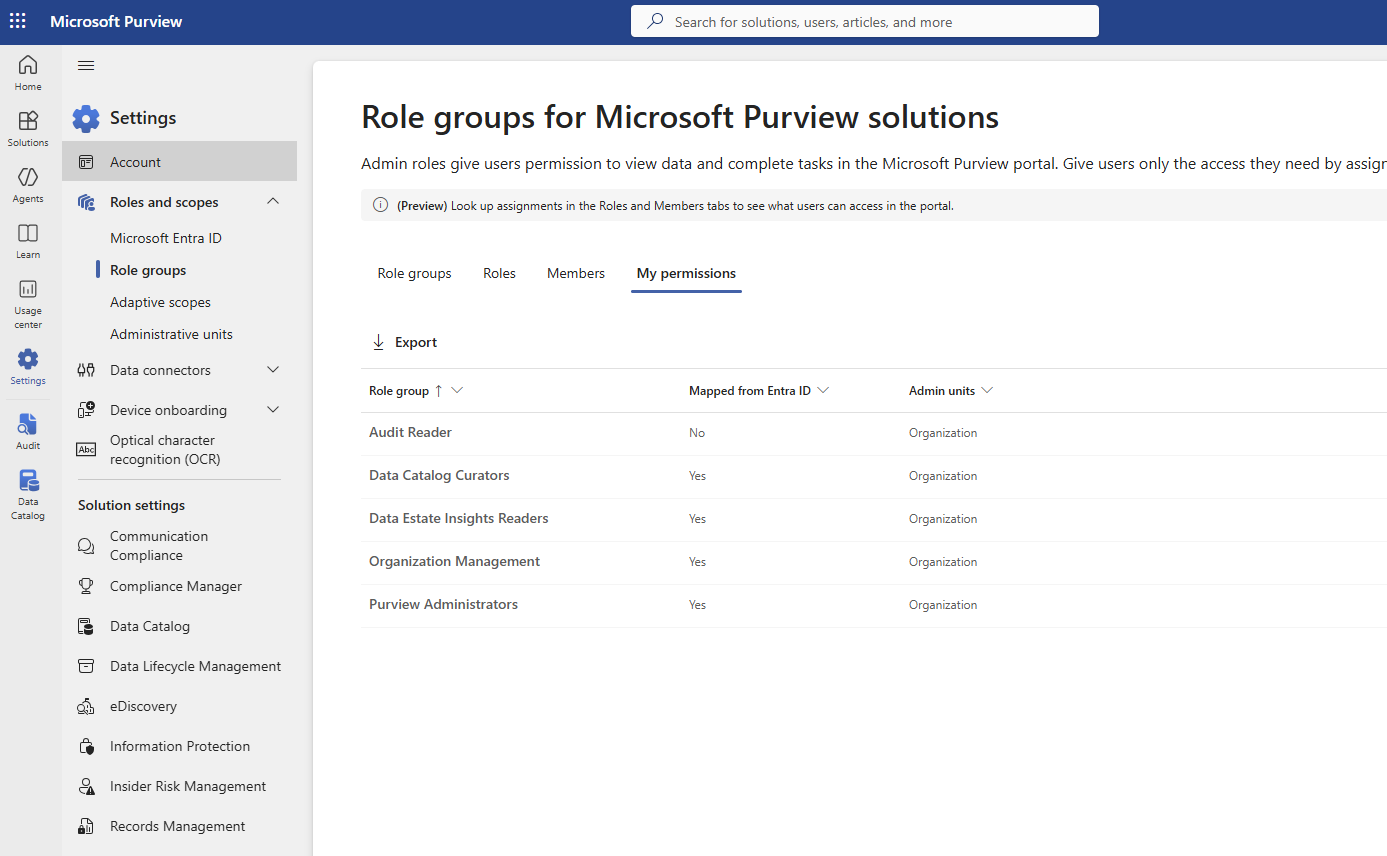
My permissions — five role groups in effect. The "Mapped from Entra ID: No" on Audit Reader is the diagnostic detail: it was added directly in Purview, not inherited through an Entra group. Organization Management and Purview Administrators both show Yes — but neither grants audit search rights, which is why the fix required Audit Reader specifically.
The first successful search still came back empty — audit recording only captures activity from the moment it is switched on. A second, correctly-windowed search returned real entries, including two attributed not to a person but to Power BI's own service-principal GUID refreshing its internal admin-monitoring models. Distinguishing "a real user action" from "normal platform housekeeping sharing the same audit pipeline" is itself the skill an audit log is meant to develop.
Part 5 — Git Integration: A Step-by-Step Setup and an Honest Platform Bug
Before starting this part: A GitHub account and an empty repository created (you will need to add at least one file to it before Fabric can connect — the setup flow will prompt you if you skip this). Your Fabric account must be a direct member of the AW-POC-Admins Entra security group, and you need Fabric tenant admin access to enable the Git integration settings in the Admin portal.
Fabric's native Git integration connects a workspace directly to a GitHub or Azure DevOps repository — enabling source control, CI/CD pipelines, and durable version history for notebooks, pipelines, and semantic models. Setting it up for this project required navigating a two-layer admin gate that is not well documented, a credential trap that produces a misleading error, an empty-repository blocker, and ultimately a genuine platform-side bug diagnosed through controlled isolation testing.
This section documents every step — including the failure modes — so you can reproduce it cleanly.
Phase 1 — Enable Git integration in the Admin portal (two separate toggles)
Toggle 1: the master switch
In the Fabric Admin portal → Tenant settings, search for "Git integration." The first setting — "Users can synchronize workspace items with their Git repositories" — is the master switch. Without it, the Git integration tab inside Workspace Settings shows nothing at all.
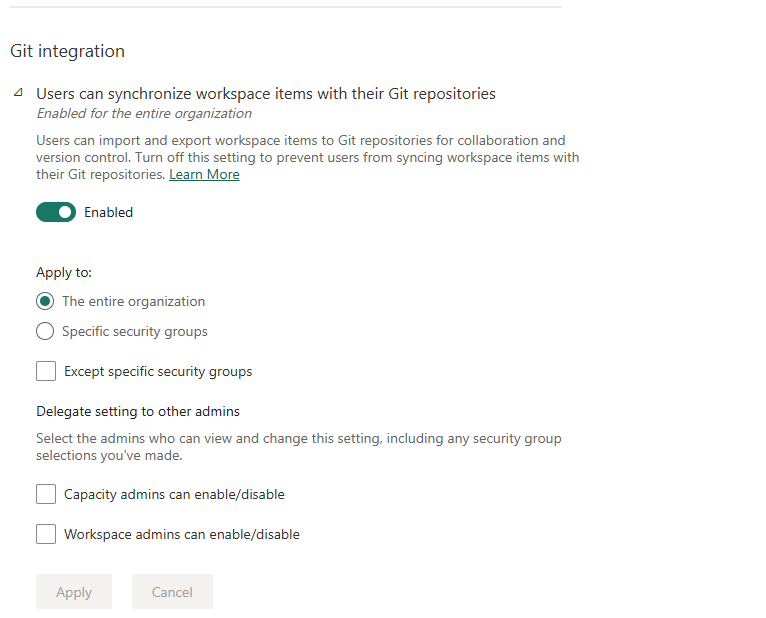
Master toggle — enable for the entire organisation or scope it to a specific security group. This controls all Git providers (Azure DevOps and GitHub).
Toggle 2: the GitHub-specific switch
Scroll down past the master toggle. A second, separate setting controls GitHub specifically: "Users can sync workspace items with GitHub repositories." This toggle only appears once the master switch is on. GitHub will not appear as a provider in Workspace Settings until both toggles are enabled — Azure DevOps only requires the first.
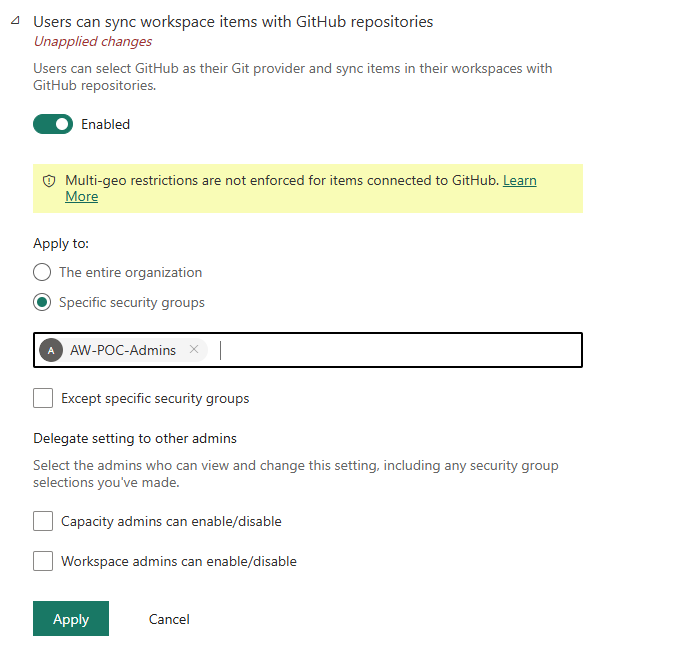
GitHub-specific toggle — scoped to the AW-POC-Admins security group. Note the multi-geo warning: GitHub connections bypass regional data residency enforcement.
Two things worth noting on this screen. First, the security group AW-POC-Admins is used instead of "The entire organisation" — this limits Git integration to the accounts that actually need it, following least-privilege for tenant-level features. Second, the multi-geo warning is genuine: items connected to GitHub are not subject to Fabric's multi-geo data residency restrictions. If your organisation has compliance requirements about where data lives, this matters before you connect any workspace.
Wait for propagation
After clicking Apply on either setting, a notification confirms the change — but changes take up to 15 minutes to apply across the tenant.
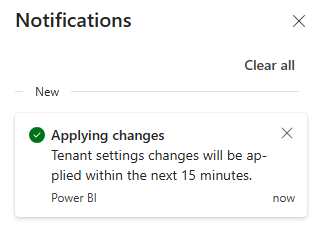
Do not test immediately after saving — wait the full 15 minutes or the Workspace Settings Git integration tab will appear as if neither switch was ever enabled.
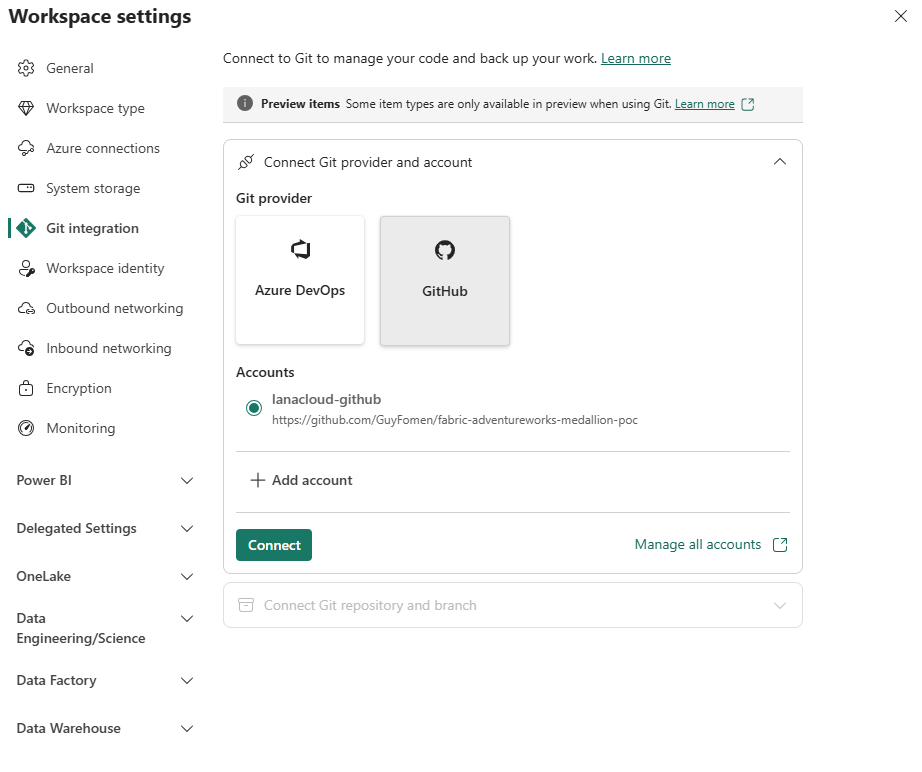
Phase 2 — Workspace Settings: both providers now visible
After the propagation window, open Workspace Settings → Git integration. With both tenant toggles enabled, both Azure DevOps and GitHub appear as selectable providers.
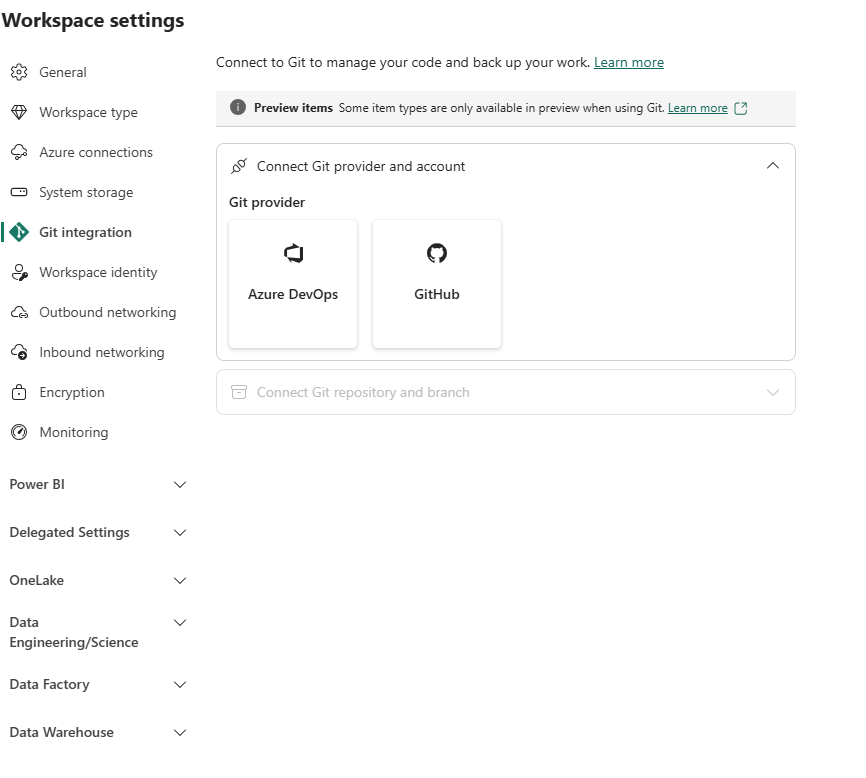
Both providers visible — Azure DevOps (left) and GitHub (right). If only one toggle was enabled, only Azure DevOps would appear.
Phase 3 — Create a GitHub Personal Access Token (classic, not fine-grained)
This is the single most common point of failure. Fabric's Git integration requires a classic Personal Access Token (PAT). Fine-grained tokens — GitHub's newer, more permission-scoped token type — are rejected with a Git_GitProviderCredentialsNotAuthorizedError that gives no hint about which token type is the problem.
On GitHub, go to Settings → Developer settings → Personal access tokens → Tokens (classic):
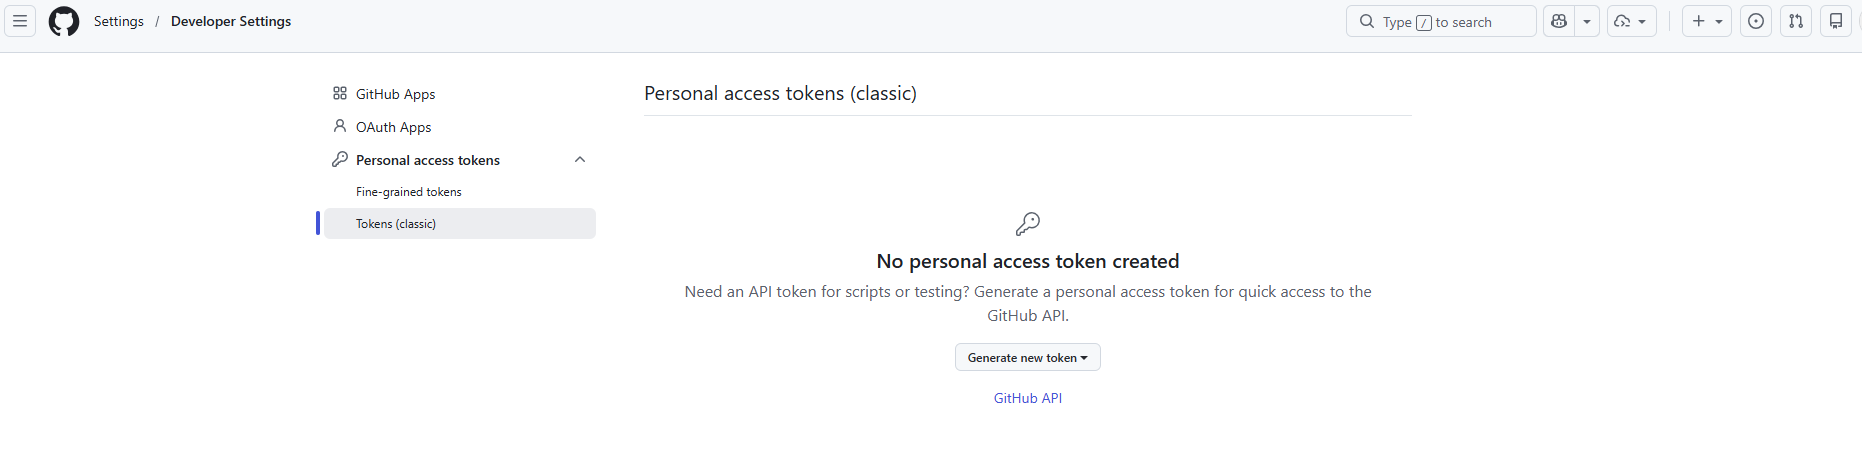
GitHub → Settings → Developer settings → Personal access tokens → Tokens (classic). Do not use Fine-grained tokens — they will fail.
For reference, this is what the fine-grained token creation page looks like — the token named fabric-adventureworks-poc, scoped to the single repository GuyFomen/fabric-adventureworks-medallion-poc, with 90-day expiry:
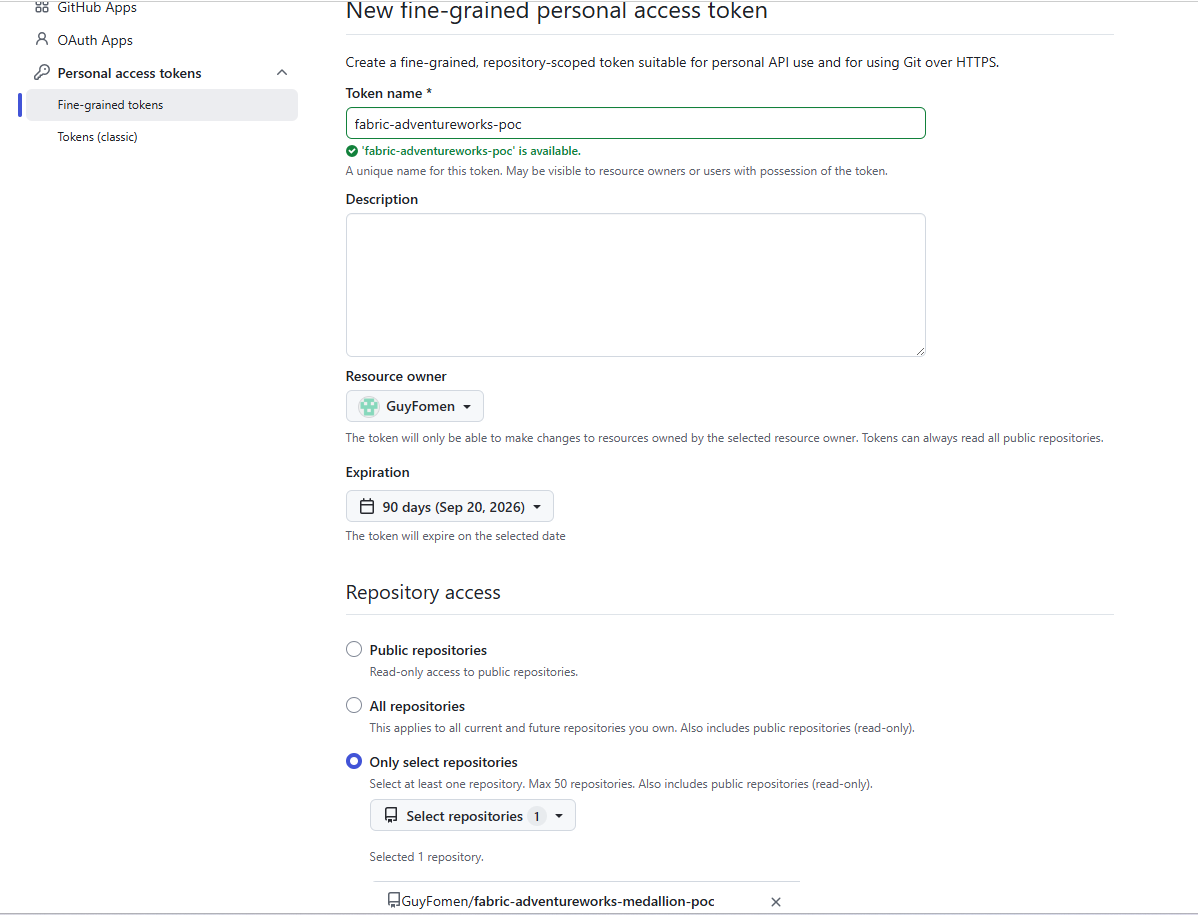
Fine-grained token — correctly scoped to one repository, but rejected by Fabric. The error message does not mention token type. Use Tokens (classic) instead.
Generate a classic token with the repo scope (full control of private repositories). Copy it immediately — GitHub will not show it again.
Phase 4 — Add the GitHub account in Fabric
Back in Workspace Settings → Git integration → GitHub, click Add account. The "There aren't any accounts" state is expected on first connection:
Fill in the Add GitHub account dialog:
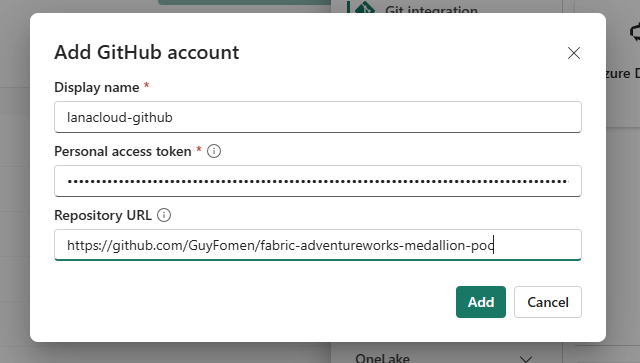
Add GitHub account — display name: lanacloud-github, PAT: classic token, Repository URL: https://github.com/GuyFomen/fabric-adventureworks-medallion-poc
| Field | Value used |
|---|---|
| Display name | lanacloud-github |
| Personal access token | (classic PAT, repo scope) |
| Repository URL | https://github.com/GuyFomen/fabric-adventureworks-medallion-poc |
After clicking Add, the account appears in the provider panel and the Connect button becomes active:
Account lanacloud-github registered against the repository URL. Connect button is now active.
Phase 5 — Connect the repository and branch (empty repo blocker)
Click Connect. If the GitHub repository has no branches yet, Fabric shows a warning:
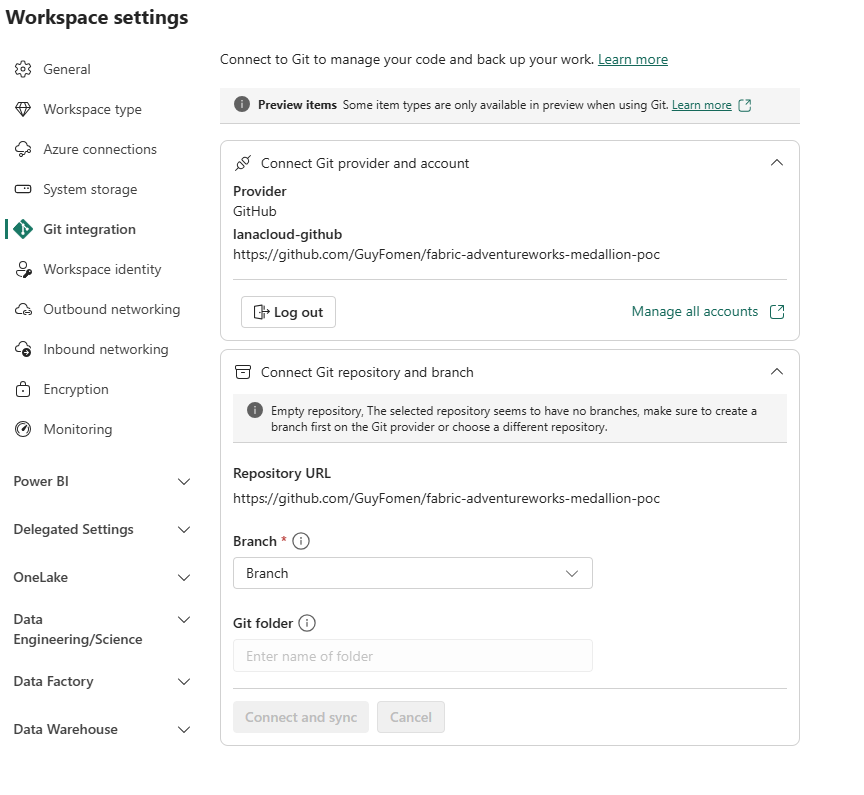
"Empty repository — make sure to create a branch first on the Git provider." The Branch dropdown is empty; Connect and sync remains greyed out.
Fix: Go to GitHub, create the
mainbranch (or any branch) by committing any file — a README is enough. Return to Fabric and re-open the Branch dropdown.
After creating the branch in GitHub, the dropdown populates:
Branch dropdown after creating main in GitHub — both "New Branch" and "main" are now selectable. Choose main and proceed to Connect and sync.
Select main, leave the Git folder field empty (Fabric uses the repo root by default), and click Connect and sync.
Phase 6 — The platform bug: when the error is not yours to fix
With every configuration step correct — both admin toggles enabled, classic PAT, account registered, branch selected — the connect-and-sync step completed. The connection was established. But the subsequent commit action failed with Git_ItemNotFound.
Rather than keep guessing, a deliberate controlled isolation test:
- New workspace, same repo, new branch. Identical failure.
- Same throwaway workspace, new repo, new credential. Identical failure again.
Three independent variables — workspace, repository, credential — swapped one at a time, with the failure unchanged every time. What did stay constant across all three attempts was the backend cluster URI visible in the error detail. That is not a workspace setting or anything accessible from the Fabric UI — it is the regional backend cluster the tenant is assigned to.
Conclusion: this was not a misconfiguration. It is a fault in how that specific backend cluster handles Git item-lookup operations, sitting entirely server-side. On an enterprise tenant with a support contract, this is exactly the kind of finding that warrants a ticket with a clean three-step repro attached. On a personal trial tenant, there is no support channel — so the right move was to stop debugging a wall that is not yours to fix, document the root cause, and adopt a durable workaround:
- Notebook code → exported as
.ipynbfiles and pushed to GitHub manually - Semantic model → exported via Tabular Editor's TMDL export (connected via XMLA endpoint)
- Pipelines → exported as JSON templates from the Data Factory UI
These exports became the permanent source-control path for this project — not a stopgap, but a deliberate decision once the root cause was confirmed as server-side.
The broader engineering lesson: when a cloud platform error persists identically across every client-side variable you can swap, that consistency is the diagnosis. A controlled, one-variable-at-a-time elimination test is the fastest way to distinguish "I configured something wrong" from "this is on the platform's side" — and which conclusion you reach determines what is actually worth your time next.
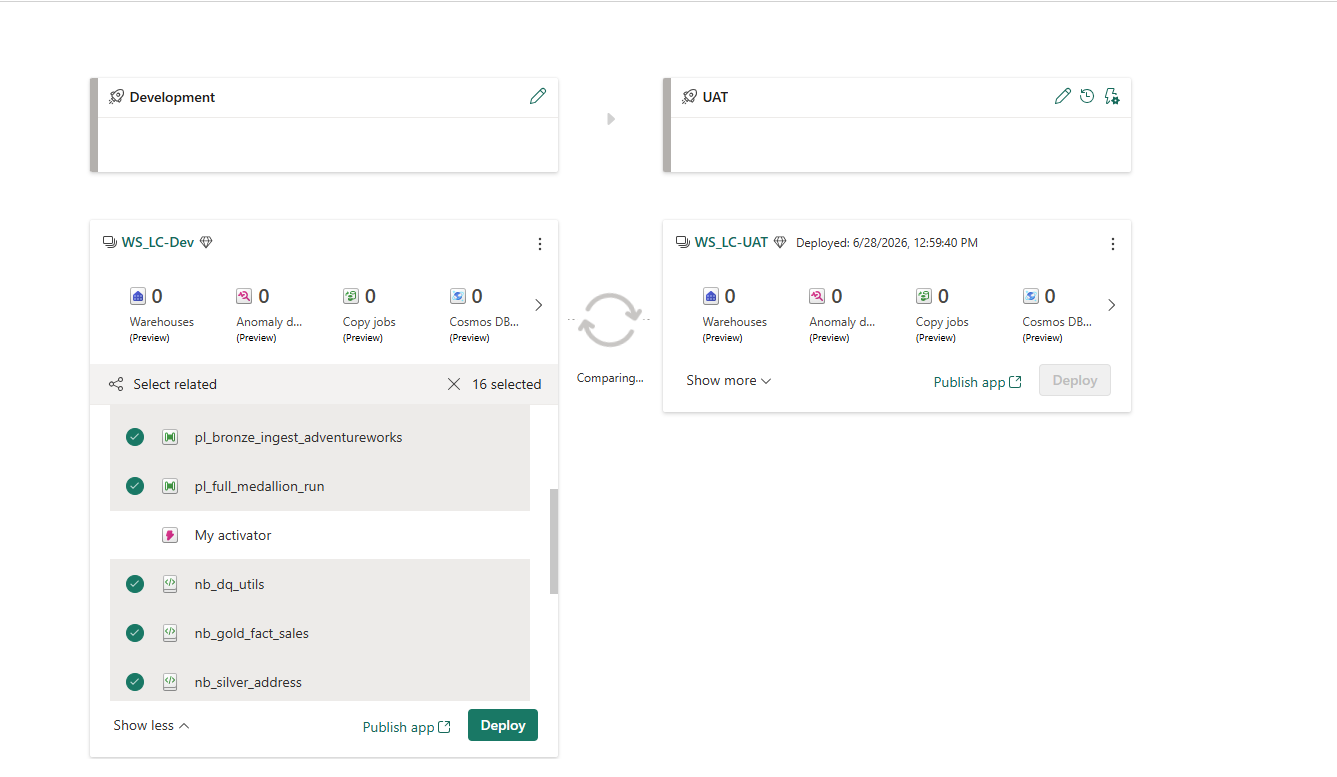
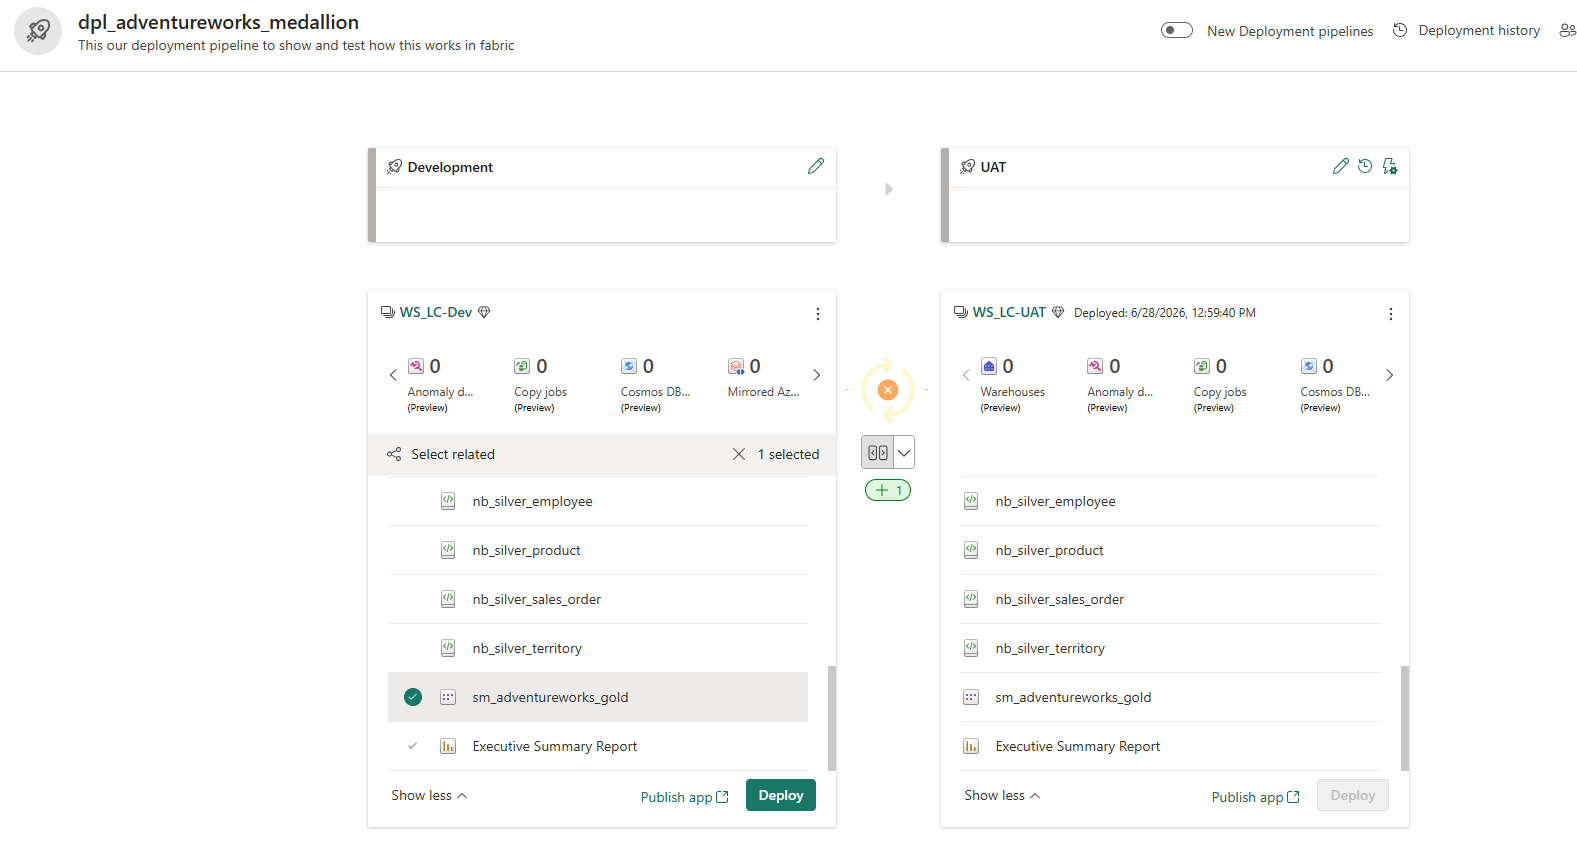
Part 5b — Deployment Pipelines: Promoting the Full Stack from Dev to UAT
Before starting this section: Both WS_LC-Dev and WS_LC-UAT workspaces must exist within the same Fabric capacity. You need workspace admin access on both. The full Dev workspace should be complete — all notebooks, pipelines, Lakehouses, semantic model, and report built and tested. A Fabric capacity admin must enable the Deployment Pipelines feature in the Admin portal if not already active.
A Fabric Deployment Pipeline is a structured promotion tool: it compares two workspace stages side by side (Development → UAT, or UAT → Production), shows exactly what is new or changed, and copies selected items from one stage to the next in a single click. Without this, promoting a medallion architecture across environments means manually recreating every notebook, pipeline, and semantic model — duplicating the exact kind of error-prone work this project was designed to avoid.
The pipeline for this project is dpl_adventureworks_medallion:
dpl_adventureworks_medallion — two-stage pipeline: Development (WS_LC-Dev) on the left, UAT (WS_LC-UAT) on the right. The stage arrow in the middle compares the two workspaces and shows what is new, modified, or identical between them.
Step 1 — Organise both workspaces with a consistent folder structure
Before deploying anything, both workspaces were given the same numbered folder structure. This is not enforced by Fabric — it is a deliberate convention that makes the inventory readable in both environments and prevents items from landing at the root level with no organisational context:
Both workspaces share the same seven-folder structure. Items deployed from Dev land in the matching folder in UAT automatically. The vl_adventureworks_lakehouses variable library (visible in Dev) is the mechanism that tells notebooks which Lakehouse GUIDs to use per environment — see Step 2.
Step 2 — Create the variable library to handle environment-specific GUIDs
The single biggest challenge in promoting notebooks between environments is that Fabric Lakehouse IDs are GUIDs — globally unique identifiers that differ between Dev and UAT even when the Lakehouse has the same name. A notebook hardcoded to the Dev Bronze Lakehouse GUID will silently read from the wrong source in UAT.
The solution is a Fabric Variable Library (vl_adventureworks_lakehouses) — a workspace-level item that stores named variables with environment-specific value sets. Each notebook references LKH_bronze, LKH_silver, LKH_gold, and WorkspaceId by name; the active value set determines which GUID is actually resolved at runtime:
Variable library — four GUID variables, two value sets. When the active value set is switched from Default (Dev) to UAT, every notebook reading from this library resolves to the UAT Lakehouse IDs automatically — no notebook code changes required.
| Variable | Type | Dev value | UAT value |
|---|---|---|---|
LKH_bronze |
Guid | Dev Bronze Lakehouse ID | UAT Bronze Lakehouse ID |
LKH_silver |
Guid | Dev Silver Lakehouse ID | UAT Silver Lakehouse ID |
LKH_gold |
Guid | Dev Gold Lakehouse ID | UAT Gold Lakehouse ID |
WorkspaceId |
Guid | Dev workspace ID | UAT workspace ID |
Step 3 — Know what cannot be deployed before you start
Fabric Deployment Pipelines support most item types, but not all. Clicking Deploy on the first attempt produced this warning:
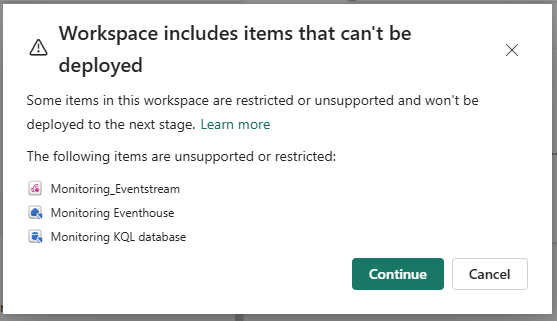
Three Workspace Monitoring items are explicitly unsupported in deployment pipelines: Monitoring_Eventstream, Monitoring Eventhouse, and Monitoring KQL database. These must be configured manually in each environment. Clicking Continue proceeds with the deployable items and skips these three.
The three unsupported item types are all part of Workspace Monitoring (Part 8). They must be provisioned separately in UAT by enabling Workspace Monitoring in the UAT workspace settings — the same one-click activation used in Dev.
A second blocker appeared when the Data Activator item was included in the deployment selection:
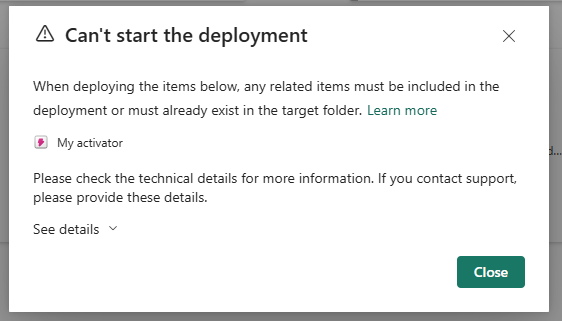
'Can't start the deployment' — the Activator item has a dependency (the Monitoring Eventhouse it queries) that is itself not deployable. Since the dependency can't travel with it, the Activator can't be deployed either. Fix: deselect My Activator from the deployment and configure it manually in UAT after the Eventhouse is provisioned there.
Step 4 — Select items and deploy
With the Activator excluded and the Monitoring warning acknowledged, the deployment canvas shows 16 deployable items selected via Select related — which automatically includes all items that share dependencies with the manually selected ones:
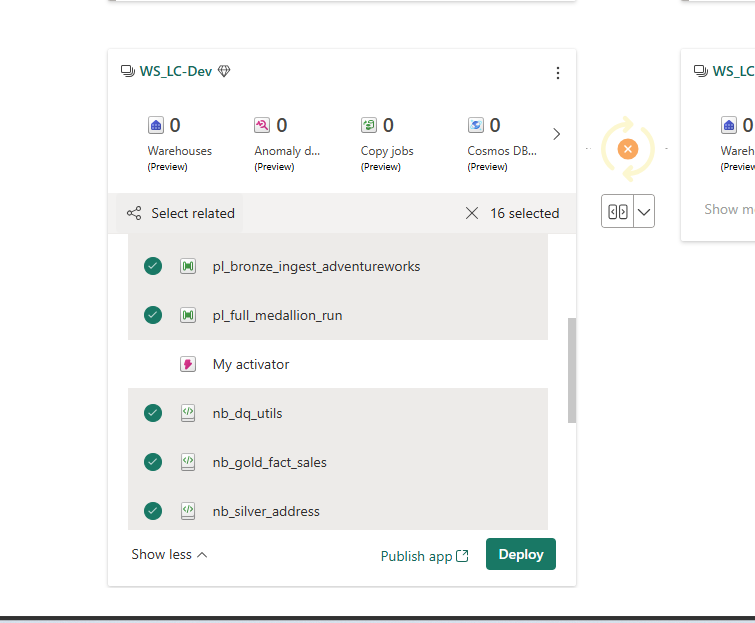
16 items selected — pipelines, all notebooks, Lakehouses, semantic model, and report. My Activator is explicitly deselected (no green check). The orange spinner on the UAT side indicates the pipeline is comparing Dev and UAT before enabling the Deploy button.
Clicking Deploy opens the confirmation dialog listing what will be created in UAT:
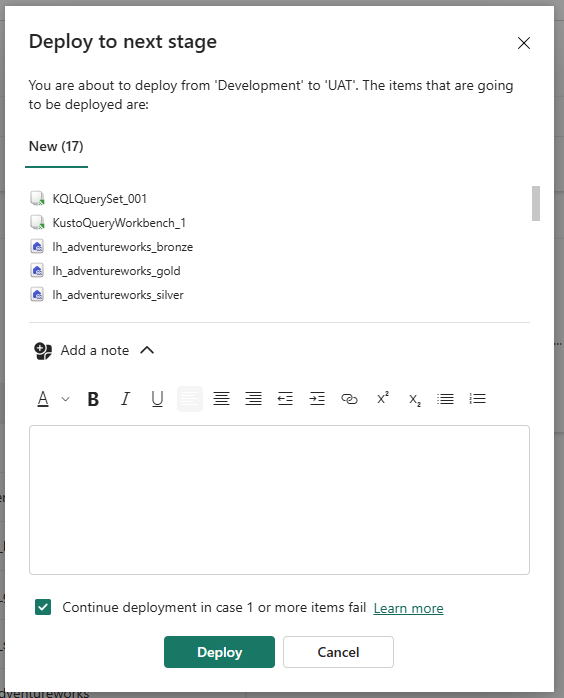
Deploy to next stage — 17 New items going to UAT for the first time. 'Continue deployment in case 1 or more items fail' is checked — this ensures that a single item failure (e.g. a permissions issue on one notebook) does not block the rest of the deployment.
After deployment completes, the pipeline compares the two stages in real time:
Post-deployment comparison — WS_LC-UAT timestamped 6/28/2026, 12:59:40 PM. The hatched pattern on items in UAT means they are now identical to their Dev counterparts. My Activator shows '+ New' in Dev because it was excluded and does not yet exist in UAT.
Step 5 — Configure deployment rules to remap environment references
Deploying copies item definitions exactly — which means any hardcoded Lakehouse reference in a notebook points to the Dev Lakehouse even after landing in UAT. Deployment rules are per-item overrides that rewrite specific references automatically during each deployment.
The Deployment rules panel (accessible from the UAT stage settings) lists every item that supports rules:
![Deployment rules [UAT] panel — lists nb_dq_utils, nb_gold_fact_sales, nb_silver_address, nb_silver_employee, nb_silver_product, nb_silver_sales_order, nb_silver_territory (all Notebook type) and sm_adventureworks_gold (Semantic model type).](/static/website/images/blog/deployment/deployment_7.png)
Deployment rules [UAT] — all seven notebooks and the semantic model support rules. Each item is configured separately. Rules run automatically on every subsequent deployment to this stage — you configure them once, not per-deploy.
For each notebook, the Additional lakehouses rule maps the Dev Lakehouse name to the UAT Lakehouse ID and workspace ID. Without this rule, the notebook in UAT still reads from the Dev Lakehouse:
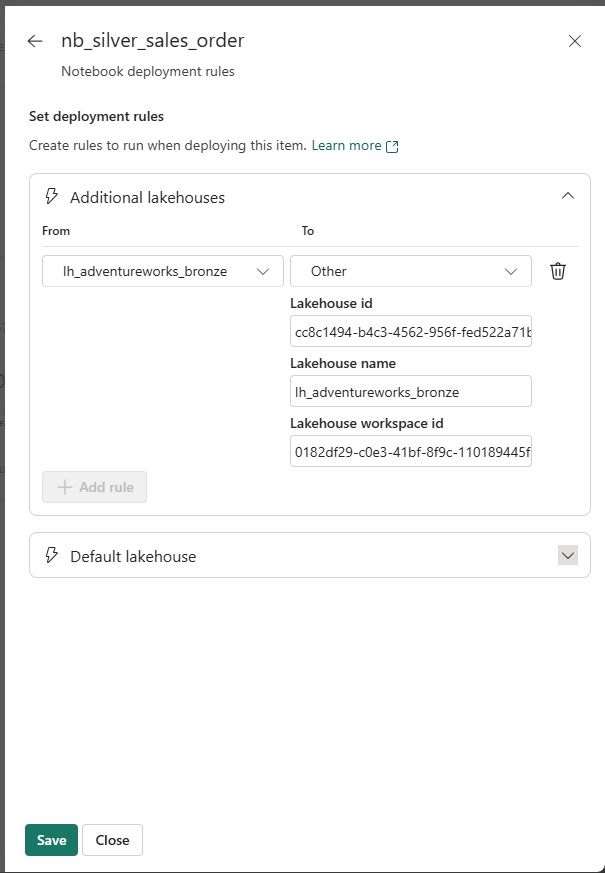
nb_silver_sales_order deployment rule — the Dev Bronze Lakehouse is remapped to the UAT Bronze Lakehouse (different GUID, same name). This rule is applied automatically every time this notebook is deployed from Dev to UAT. Repeat this for every notebook that references a Lakehouse.
Step 6 — Handle the semantic model's OneLake URI
The semantic model presents a different challenge. The sm_adventureworks_gold model contains a Shared Expression named OneLakeURI — a parameterized M expression holding the full DFS path to the Dev Gold Lakehouse. This path contains the Dev workspace GUID, which is meaningless in UAT.
Viewing this expression in Tabular Editor (connected via the Dev XMLA endpoint) shows the hardcoded URI:
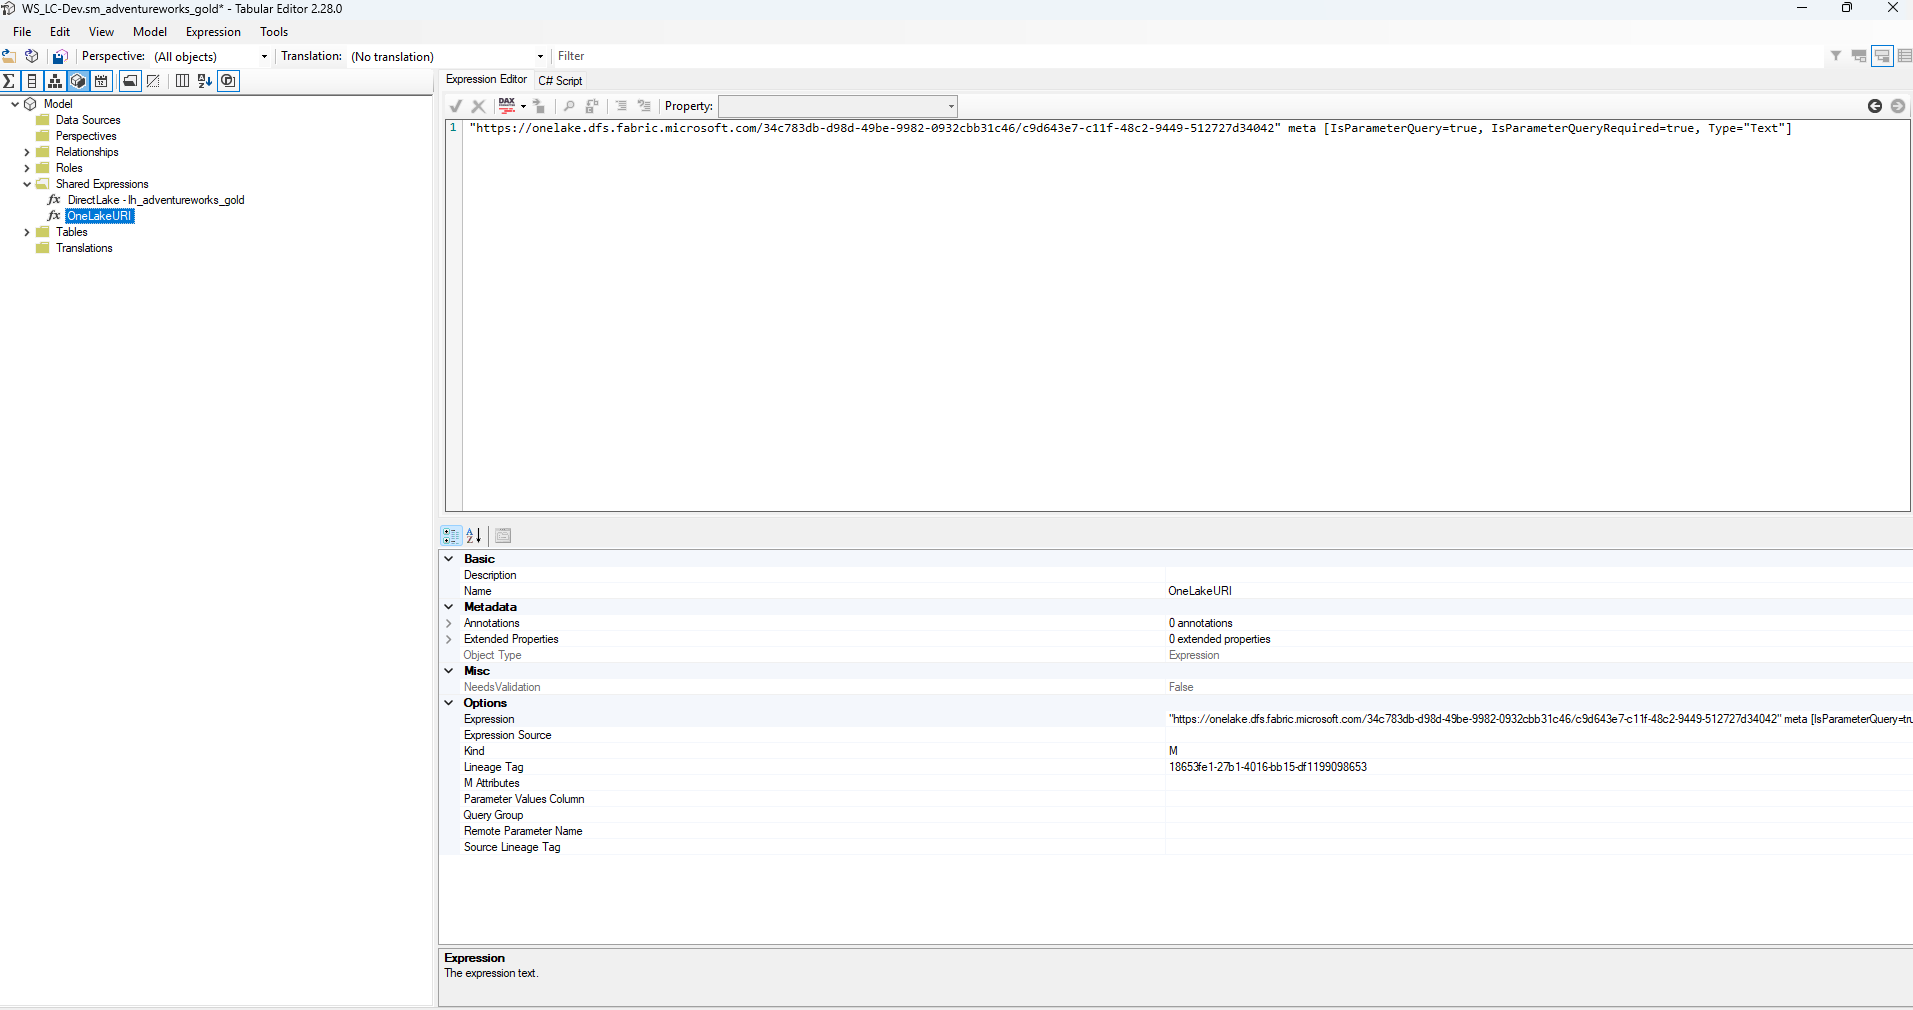
OneLakeURI shared expression — a parameterized M expression embedding the Dev Lakehouse's full DFS path. Because it is marked IsParameterQuery=true, it is overridable via a deployment rule Parameter rule. The UAT value set in the variable library provides the correct UAT URI.
The sm_adventureworks_gold deployment rules panel shows where this override is configured — under Parameter rules, a rule maps OneLakeURI to the UAT Lakehouse URI on each deployment:
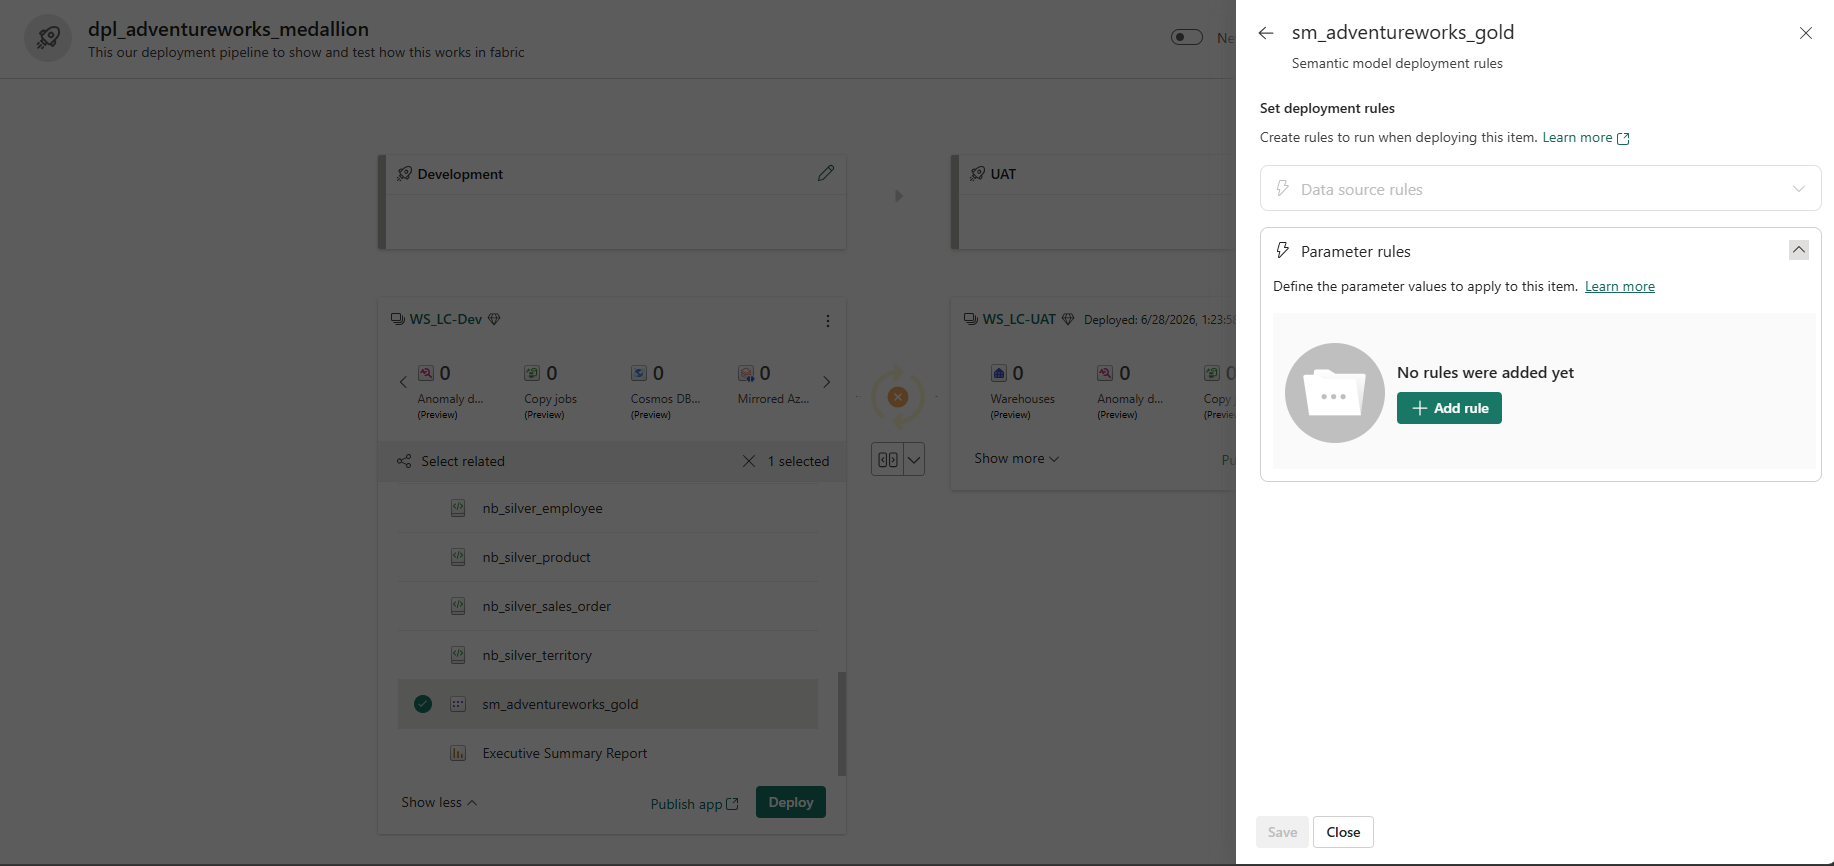
Semantic model Parameter rules — the + Add rule button is where you map the OneLakeURI parameter to the UAT Lakehouse DFS path. Once saved, every subsequent deployment automatically rewrites the URI, keeping the UAT model pointed at the correct UAT Lakehouse without manual edits in Tabular Editor.
To deploy the semantic model selectively (for example, after updating only the model definition without redeploying all notebooks), select it alone from the Dev canvas:
Selective deployment — only sm_adventureworks_gold selected. The Executive Summary Report is shown with a lighter check because it depends on the semantic model and will be included automatically. The +1 badge on the comparison arrow confirms exactly one item is new or changed relative to UAT.
Step 7 — Verify the UAT environment
After a successful deployment, the UAT Gold Lakehouse is accessible with the same structure as Dev — confirming that the medallion layers, tables, and endpoints reproduced correctly across the environment boundary:
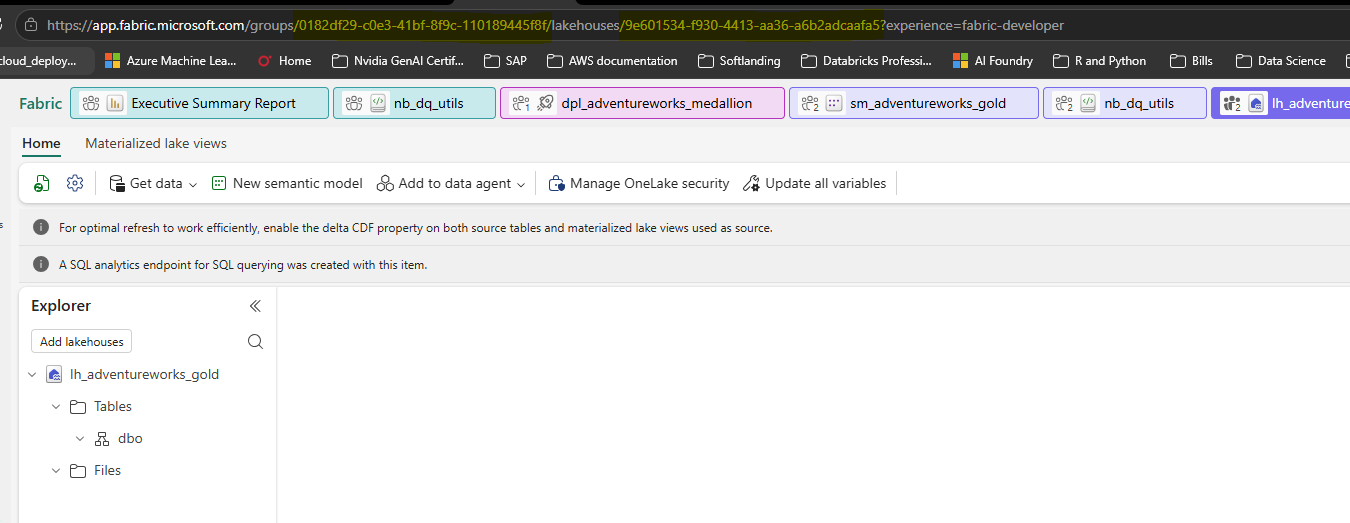
UAT lh_adventureworks_gold — same structure as Dev, different workspace GUID in the URL. The 'Update all variables' button in the toolbar triggers the variable library to switch its active value set, updating all GUID references across notebooks simultaneously.
What the deployment pipeline does and does not handle
| Item | Deployed automatically | Manual step required |
|---|---|---|
| Notebooks (all 7) | Yes — code and dependencies copied | Deployment rules to remap Lakehouse IDs |
| Pipelines (Bronze + orchestration) | Yes | Verify connection references point to UAT gateway |
| Lakehouses (Bronze, Silver, Gold) | Yes — structure only, no data | Data runs from the UAT pipeline schedule |
| Semantic model | Yes | Parameter rule for OneLakeURI; reconnect report |
| Executive Summary Report | Yes | Re-verify RLS roles reference UAT identities |
| Workspace Monitoring (Eventstream, Eventhouse, KQL) | No — unsupported item type | Enable Workspace Monitoring in UAT workspace settings |
| Data Activator | No — dependency on undeployable Eventhouse | Recreate manually in UAT after Eventhouse is provisioned |
| Security groups and workspace roles | No | Assign Entra groups to UAT workspace roles separately |
| On-premises gateway connection | No | Create conn_adventureworks_onprem in UAT pointing to same gateway |
Part 5c — User Data Functions: Exposing Gold Data as a REST API
Before starting this section: The Gold Lakehouse must be populated and deployed to UAT (Part 2 and Part 5b complete). You need workspace member access on WS_LC-UAT. The User Data Functions feature must be enabled by a Fabric capacity admin in the Admin portal.
Everything built so far exposes data through the Power BI report or through notebooks triggered by a pipeline schedule. Fabric User Data Functions (UDF) add a third consumption channel: a serverless HTTP endpoint that any application, script, or API client can call directly — no Power BI license required, no Spark cluster to spin up. The function runs Python, queries the Gold Lakehouse via the connection alias you configure, and returns JSON. The result is a lightweight, authenticated REST API backed by your medallion Gold layer.
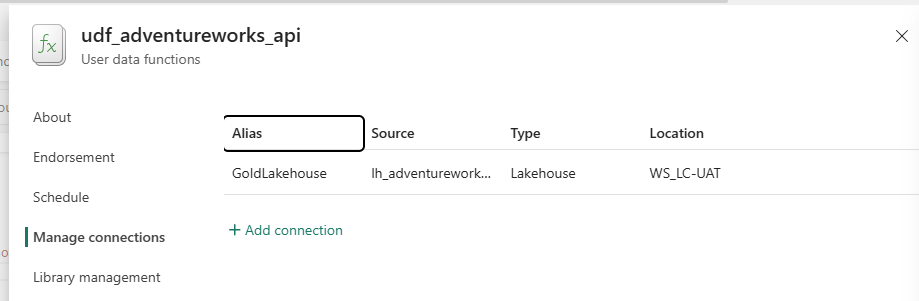
For this project, the item is udf_adventureworks_api:
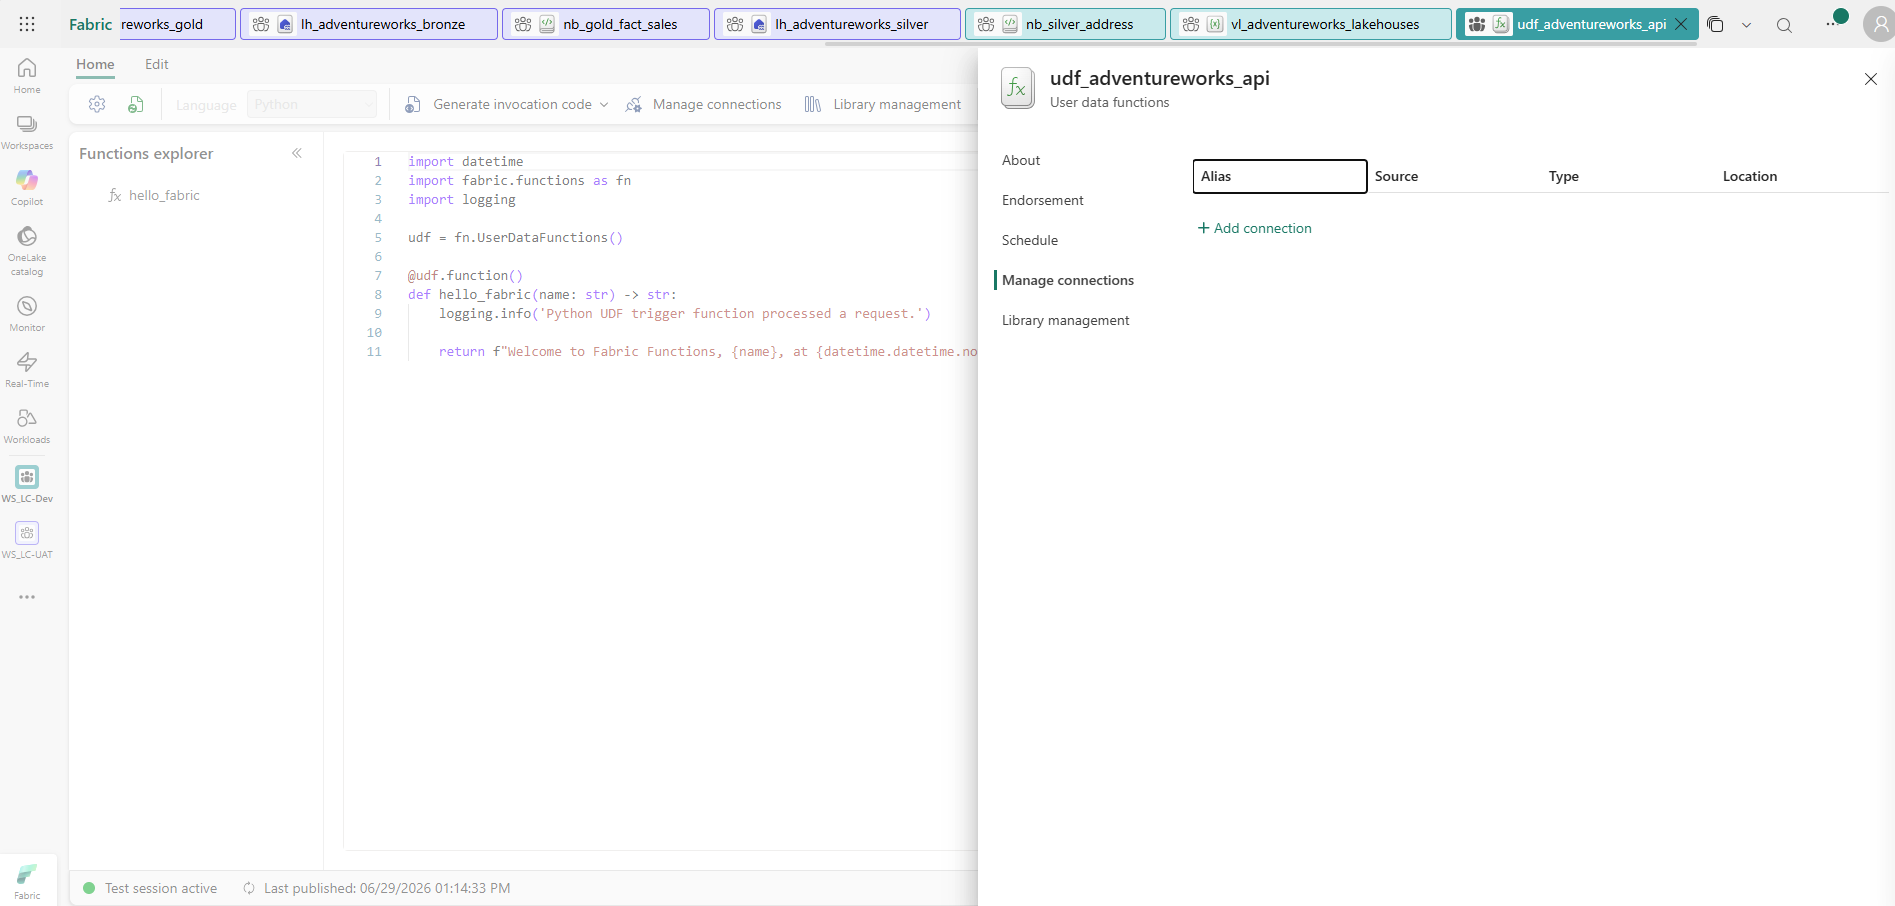
udf_adventureworks_api — the Fabric User Data Functions item. Language is Python. The @udf.function() decorator marks each Python function as an HTTP-invocable endpoint. The starter hello_fabric function is provided automatically; additional functions are added to the same item. The Manage connections panel on the right is where you wire up Lakehouse access before writing any query code.
Step 1 — Connect the function item to the Gold Lakehouse
User Data Functions access Fabric data sources through named connections configured in the Manage connections panel. Each connection gets an alias that the Python code uses — not a hardcoded Lakehouse path. This is the same environment-isolation principle as the variable library: the code references the alias, and the alias is wired to the appropriate Lakehouse per environment.
The Insert sample menu (Edit tab → Insert sample → Lakehouse) shows all the patterns the IDE can scaffold for you — including Query data from lakehouse tables, which generates the correct fabric.functions boilerplate:
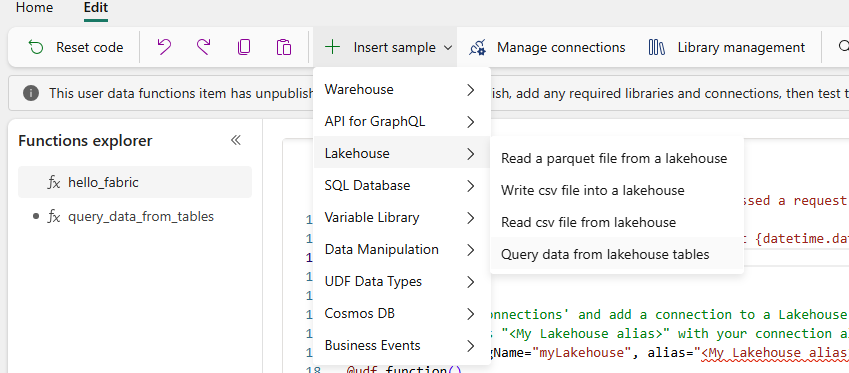
Insert sample → Lakehouse → Query data from lakehouse tables inserts a working boilerplate that reads the connection alias from the Manage connections panel. The inserted code is environment-portable — point the alias at a different Lakehouse and the function queries that Lakehouse without any code changes.
After using + Add connection to wire up the UAT Gold Lakehouse, the connection is registered with the alias GoldLakehouse:
Connection alias GoldLakehouse wired to lh_adventureworks_gold in WS_LC-UAT. The Python code references this alias by name — if you later point the alias at the Dev Lakehouse for local testing, no function code changes.
Step 2 — Write the API functions
Two functions are implemented in udf_adventureworks_api:
get_sales_summary — accepts a date range and returns total sales (LineTotal) and order count from fact_sales in the Gold layer:
import fabric.functions as fn
from datetime import datetime

udf = fn.UserDataFunctions()

@udf.function()
def get_sales_summary(startDate: str, endDate: str) -> dict:
    """
    Total sales (LineTotal) and order count from Gold Fact Sales for a date range.
    Args:
        startDate (str): "YYYYMMDD", e.g. "20220101"
        endDate (str): "YYYYMMDD", e.g. "20221231"
    Returns:
        dict with total_sales, line_count, startDate, end_date
    """
    lh = udf.get_lakehouse_connection("GoldLakehouse")
    df = lh.execute_query(
        f"""
        SELECT SUM(LineTotal) AS total_sales, COUNT(*) AS line_count
        FROM dbo.fact_sales
        WHERE OrderDateKey BETWEEN '{startDate}' AND '{endDate}'
        """
    )
    row = df.fetchone()
    return {
        "total_sales": float(row[0]) if row[0] else 0.0,
        "line_count":  int(row[1])   if row[1] else 0,
        "startDate":   startDate,
        "end_date":    endDate,
    }
get_gold_freshness — no parameters; returns the most recent OrderDateKey in the Gold table and the number of days since that date — a data freshness signal that a monitoring dashboard or alerting system can poll:
@udf.function()
def get_gold_freshness() -> dict:
    """
    Most recent OrderDateKey in Gold Fact Sales — a freshness signal.
    Returns:
        dict with last_order_date, days_since_last_order
    """
    lh = udf.get_lakehouse_connection("GoldLakehouse")
    df = lh.execute_query(
        "SELECT MAX(OrderDateKey) AS last_order_date FROM dbo.fact_sales"
    )
    row = df.fetchone()
    last_date_str = str(row[0]) if row[0] else None
    if last_date_str:
        last_date = datetime.strptime(last_date_str, "%Y%m%d")
        days_since = (datetime.utcnow() - last_date).days
    else:
        days_since = -1
    return {
        "last_order_date":       last_date_str,
        "days_since_last_order": days_since,
    }
Learner note — why
get_gold_freshnessmatters: The Power BI report shows data as of the last pipeline run, but there is no visual indicator of data age on the report itself. A freshness endpoint gives any downstream system — a monitoring alert, a CI job, a chatbot — the ability to check whether the Gold layer is stale before surfacing data to end users. This is a pattern borrowed from API design ("health check / readiness endpoint") applied to data products.
Step 3 — Generate and use the invocation code
Once the functions are published, Fabric generates ready-to-run caller code. The Generate invocation code dialog (toolbar → Generate invocation code) produces a complete Python script for testing from a client application:
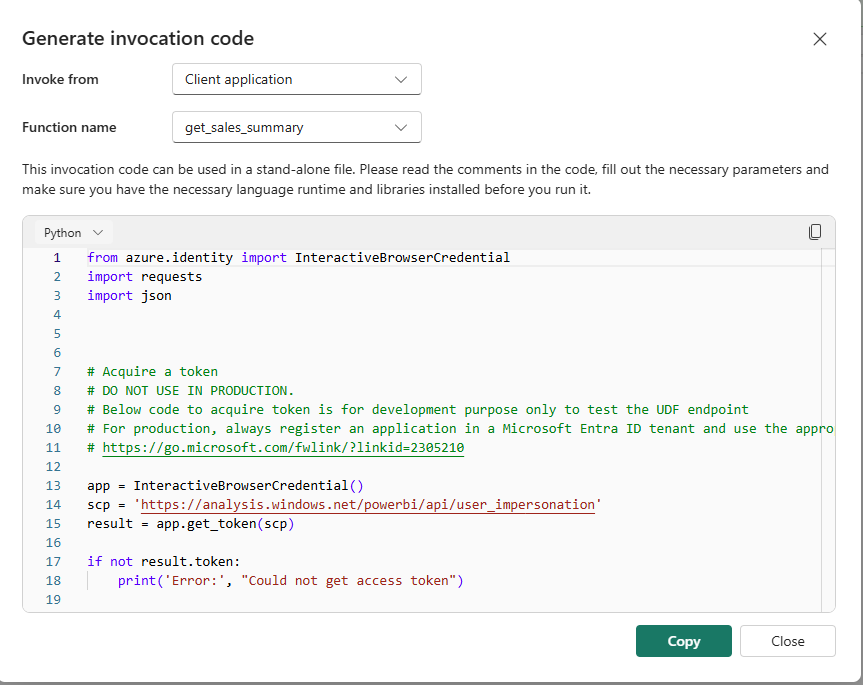
Generate invocation code — the dialog produces a self-contained Python script. The InteractiveBrowserCredential flow is for local development testing only — it pops a browser window for interactive login. In production, replace this with a service principal using client credentials (app registration + client secret or managed identity).
The generated caller, ready to run from any Python environment with azure-identity and requests installed:
from azure.identity import InteractiveBrowserCredential
import requests
import json

# Development-only token acquisition — replace with service principal for production
app = InteractiveBrowserCredential()
scp = 'https://analysis.windows.net/powerbi/api/user_impersonation'
result = app.get_token(scp)

if not result.token:
    print('Error: Could not get access token')

headers = {
    'Authorization': f'Bearer {result.token}',
    'Content-Type': 'application/json'
}

endpoint = (
    'https://34c783dbd98d49be99820932cbb31c46.z34.userdatafunctions'
    '.fabric.microsoft.com/v1/workspaces/'
    '34c783db-d98d-49be-9982-0932cbb31c46/userDataFunctions/'
    'd7711db4-78e5-4d12-b768-3f884d5fd18a/functions/get_sales_summary/invoke'
)

request_body = {
    "startDate": "20220101",
    "endDate":   "20221231"
}

response = requests.post(endpoint, json=request_body, headers=headers)

if response.status_code == 200:
    print('Function invoked successfully!')
    print(json.dumps(response.json(), indent=4))
else:
    print('Status:', response.status_code)
    print('Response:', response.text)
A successful response returns a structured envelope:
{
    "functionName": "get_sales_summary",
    "invocationId": "a1b2c3d4-...",
    "status": "Succeeded",
    "output": {
        "total_sales": 109846302.87,
        "line_count": 121317,
        "startDate": "20220101",
        "end_date": "20221231"
    },
    "errors": []
}
Step 4 — Test with Postman using the OpenAPI specification
Fabric also generates a full OpenAPI 3.0 specification, ready to import directly into Postman or any API gateway:
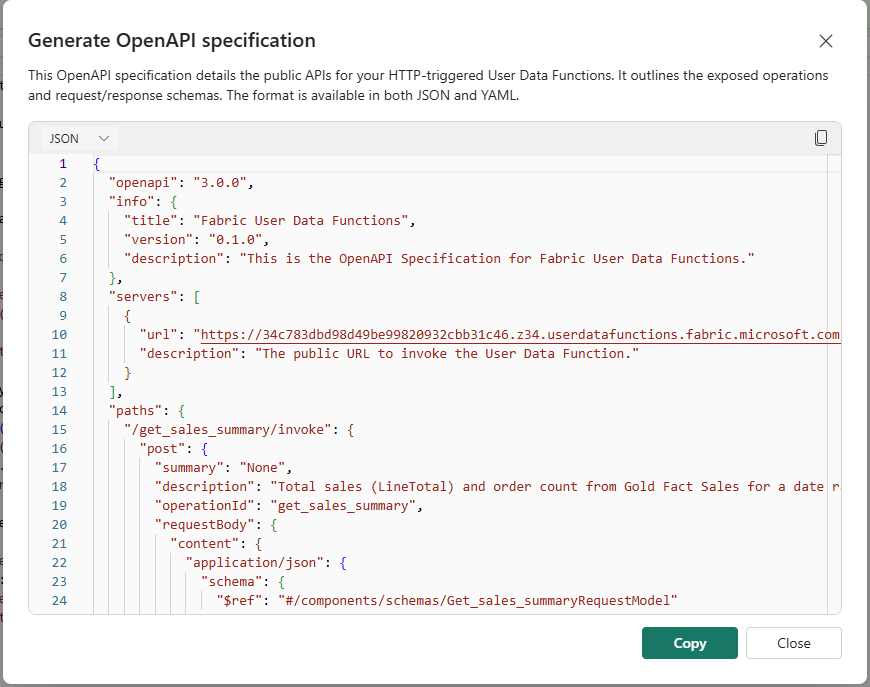
OpenAPI specification — available as JSON or YAML. Import this file into Postman using File → Import → Raw text. The spec defines the base server URL, all exposed function paths (/get_sales_summary/invoke and /get_gold_freshness/invoke), request/response schemas with all error codes (400, 401, 403, 408, 409, 413, 500), and the bearerAuth security scheme.
To test in Postman:
- Copy the full OpenAPI JSON from the dialog (Copy button)
- In Postman: Import → Raw text → paste → Continue
- Add a Bearer Token Authorization header — obtain a token via Azure CLI:
az login az account get-access-token --resource https://analysis.windows.net/powerbi/api --query accessToken -o tsv - POST to
/get_sales_summary/invokewith body{"startDate": "20220101", "endDate": "20221231"} - POST to
/get_gold_freshness/invokewith an empty body{}
What User Data Functions add to the architecture
| Access pattern | Tool | Auth | Use case |
|---|---|---|---|
| Interactive BI report | Power BI / Fabric Reports | Entra ID / RLS | Business users, executives |
| Scheduled data movement | Fabric Pipeline | Managed identity | ETL, downstream feeds |
| Programmatic API call | User Data Function | Bearer token (Entra) | Apps, automations, external consumers |
| Ad hoc notebook query | PySpark / SQL Analytics | Entra ID | Data engineers, analysts |
User Data Functions are not a replacement for the report or the pipeline — they are the data product API layer for teams that want to consume Gold data without a Power BI license or a Fabric workspace. An external Python application, a Power Automate flow, or a custom web dashboard can all call the same authenticated endpoint and receive structured JSON from the same Gold Lakehouse that the report visualizes.
Part 6 — FinOps: Turning "This Notebook Feels Slow" Into a Measured Number
Before starting this part: At least one complete end-to-end pipeline run must have executed and completed so there is CU consumption data to measure. Install the Fabric Capacity Metrics app from AppSource — this is a Microsoft-published Power BI app that requires no Fabric admin rights to install, but the workspace must have been running for at least a few days to show meaningful 14-day trend data.
Step 1 — Connect the Fabric Capacity Metrics app
The Fabric Capacity Metrics app is a Microsoft-published Power BI report available from AppSource. Install it, connect it to your Fabric capacity, and it exposes a 14-day rolling view of CU consumption broken down by workspace, item type, and item name.
Two concepts to lock in before reading any numbers:
- CU-seconds is the billing unit — the area under the compute curve over time, not a point-in-time reading
- Session Duration ≠ CU-seconds. A notebook that finishes in 200 seconds can consume 4,000 CU-seconds if it runs a heavy Spark job. Duration tells you how long you waited; CU-seconds tells you what it cost.
The app has two particularly useful pages: Compute (the raw 14-day item table) and Item History (Preview) (per-item % breakdown, status distribution, and CU by date). Both are needed to get the full picture.
Step 2 — Identify the hotspots (Compute tab)
Opening the Compute tab and sorting by CU(s) descending immediately surfaced the problem:
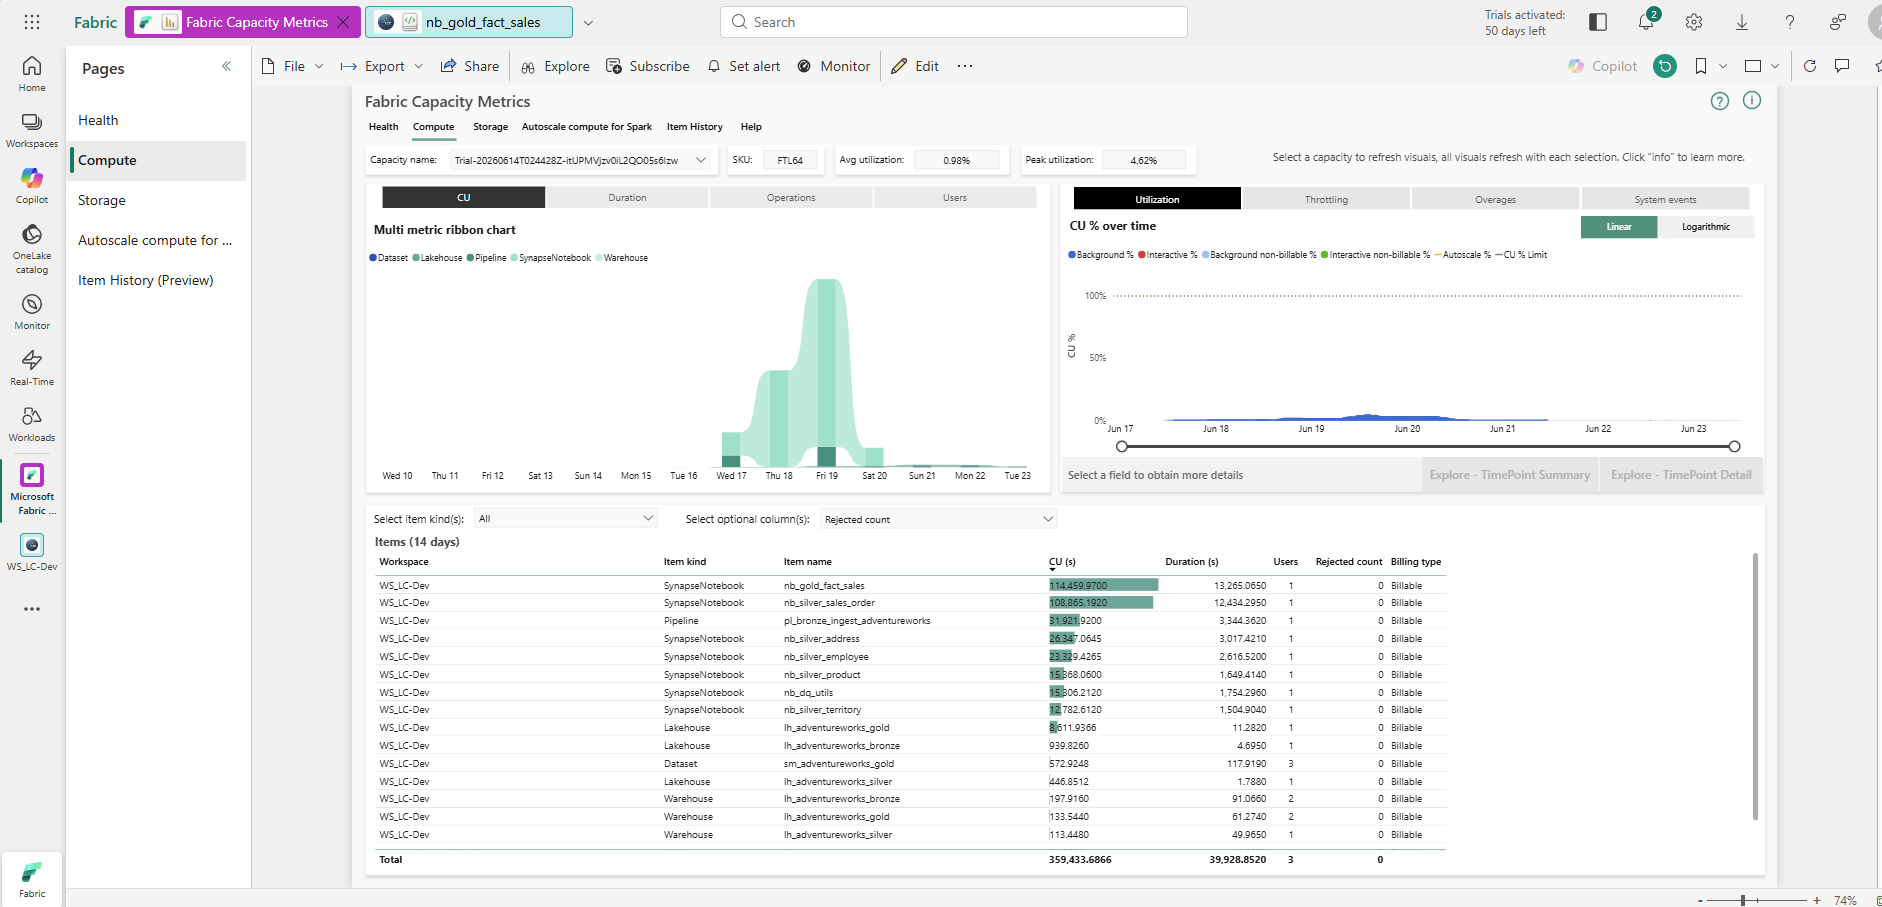
Compute tab, 14-day window — two notebooks dominate. Avg utilization 0.98%, peak 4.62% on an F64 SKU.
The data from this view:
| Item | Item kind | CU (14 days) | % of Total |
|---|---|---|---|
| nb_gold_fact_sales | SynapseNotebook | 114,459.97 | 31.8% |
| nb_silver_sales_order | SynapseNotebook | 106,865.19 | 29.7% |
| pl_bronze_ingest_adventureworks | Pipeline | 31,923.92 | 8.9% |
| nb_silver_address | SynapseNotebook | 26,347.06 | 7.3% |
| nb_silver_employee | SynapseNotebook | 22,229.43 | 6.2% |
| nb_silver_product | SynapseNotebook | 15,668.06 | 4.4% |
| nb_dq_utils | SynapseNotebook | 15,106.21 | 4.2% |
| nb_silver_territory | SynapseNotebook | 12,782.61 | 3.6% |
| Everything else | Various | 14,050.22 | 3.9% |
| Total | 359,433.69 | 100% |
Two notebooks — nb_gold_fact_sales and nb_silver_sales_order — consumed 61.6% of all CU across the entire workspace over 14 days. The other five Silver notebooks, the pipeline, and both Lakehouses shared the remaining 38.4%. Two numbers also stand out in the header row: avg utilization 0.98%, peak utilization 4.62% — on an F64 SKU that provides 64 CU. The entire workload's worst single moment consumed less than 3 CU.
Step 3 — Confirm with Item History (and find the real story)
The Item History (Preview) tab adds two things the Compute tab doesn't show: a per-item percentage breakdown, and the status distribution across all runs.
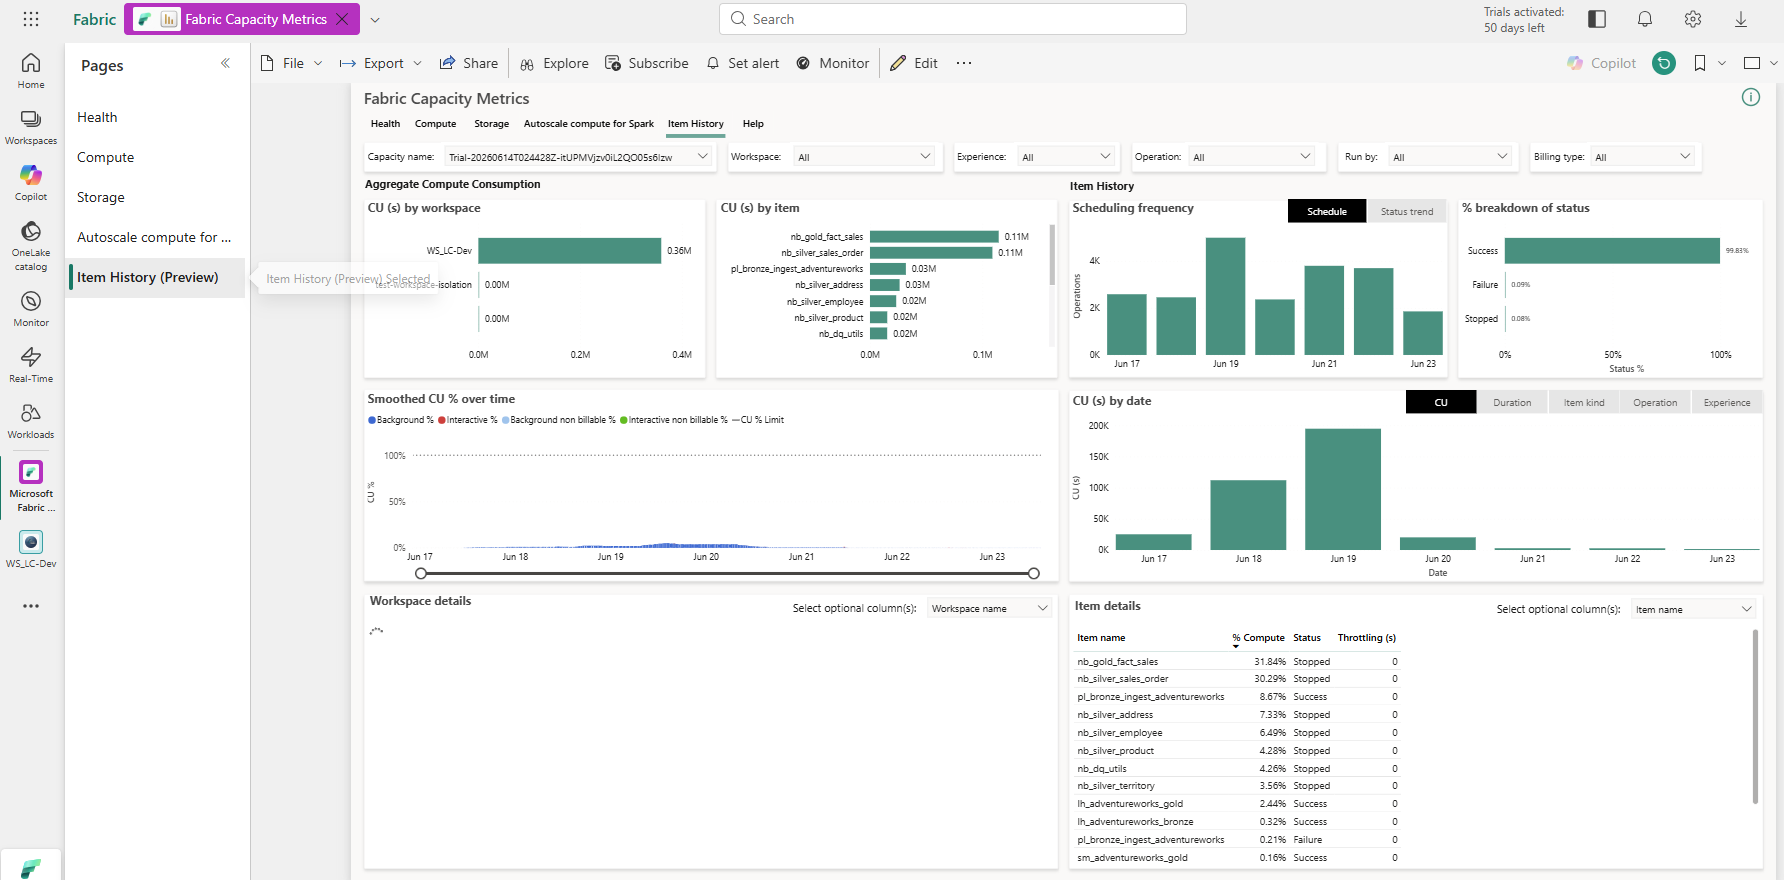
Item History — 99.81% success rate confirms the notebooks are completing correctly. The cost concentration in two items (31.84% + 30.29%) is the issue.
The % breakdown of status: 99.81% success, 0.09% failure, 0.08% stopped. The notebooks were completing correctly — this was not a reliability problem, it was an efficiency problem. Two items accounting for 62% of compute cost while running successfully is the definition of "optimize, don't debug."
The Item details panel confirms the concentration:
| Item | % Compute |
|---|---|
| nb_gold_fact_sales | 31.84% |
| nb_silver_sales_order | 30.29% |
| pl_bronze_ingest_adventureworks | 8.67% |
| nb_silver_address | 7.33% |
| nb_silver_employee | 6.49% |
The CU(s) by date chart (bottom right of Item History) shows the burst concentrating on Jun 18–20 — the intensive testing window — which also explains why the 14-day aggregate is dominated by those few days rather than being evenly distributed.
Step 4 — Right-size the capacity (before touching any code)
The capacity sizing question was already answerable before any code change. Looking at a single clean pipeline run in the Compute tab:
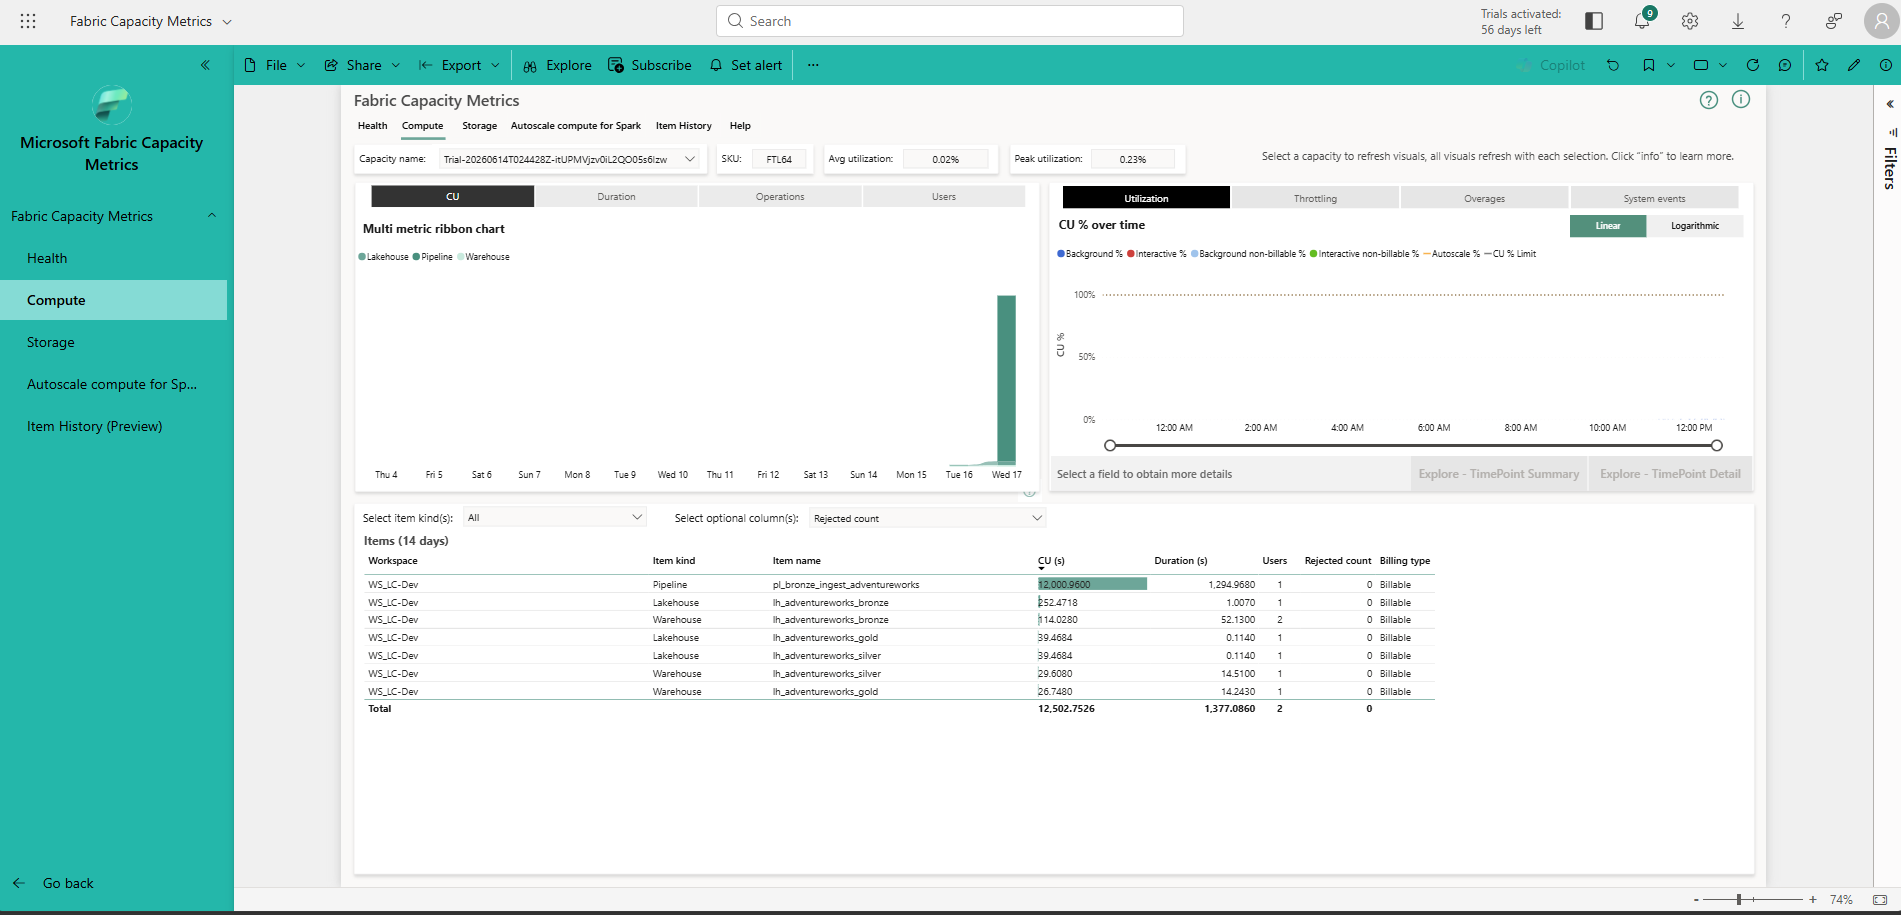
Single-run day — avg utilization 0.02%, peak 0.23% on F64. The pipeline dominates at 12,000 of 12,502 total CU for that day.
On a single clean run: avg 0.02%, peak 0.23% of F64 capacity. The pipeline activity alone consumed 12,000.97 of 12,502.75 CU that day (96%), with the Lakehouses and Warehouses splitting the remainder. Even across the most intensive 14-day window, peak utilization never exceeded 4.62% of F64.
The maths:
- F64 = 64 CU; 4.62% peak = 2.96 CU actual peak draw
- F8 = 8 CU; 2.96 CU peak = 37% of F8 capacity — comfortable headroom
- Cost delta: (64 − 8) / 64 = 87.5% capacity-cost reduction
This is the right-sizing recommendation: F8, derived from measured peak draw, not from a capacity planning spreadsheet or a rule of thumb.
Step 5 — Diagnose the root cause
Spark uses lazy evaluation: every transformation (.filter(), .join(), .withColumn()) builds a logical plan but executes nothing. Only actions — .count(), .collect(), .write() — actually trigger computation and bill CU-seconds.
That distinction is easy to acknowledge in theory and easy to forget in practice, especially in data-quality code where it feels natural to write a .count() after every check "just to confirm it looks right." The actual cost of that habit: a single dataframe in the Silver sales-order notebook was being recomputed from scratch up to eleven times across one DQ block, because nothing told Spark to cache the result between checks. Every null check, every duplicate-key check, every referential-integrity check was silently re-running the same multi-way join from zero.
One notable finding: the same anti-pattern appeared on a 10-row dimension table with zero joins — proof that the cost was never about data volume. It was about redundant Spark job-launch overhead, which the cluster bills for regardless of table size.
Step 6 — Apply the fix
The fix pattern, applied consistently across all five Silver notebooks and the shared DQ utility module:
# Cache once, immediately before any DQ checks begin
df_sales_order = df_sales_order.cache()

# One consolidated null check — not seven separate .count() calls
null_counts = df_sales_order.select([
    count(when(col(c).isNull(), c)).alias(c)
    for c in df_sales_order.columns
]).collect()[0].asDict()

log_dq_result("null_check", null_counts)

# Referential integrity — one action, reads from the cached frame
orphan_count = (
    df_sales_order
    .join(df_product, "ProductID", "left_anti")
    .count()
)
log_dq_result("referential_integrity_product", {"orphan_rows": orphan_count})

# Write to Silver — still reads from the cached frame
df_sales_order.write.format("delta").mode("overwrite").save(silver_path)

# Release memory after the write completes
df_sales_order.unpersist()
Four changes, applied systematically:
- Cache once immediately before the first DQ action — every subsequent action reads the materialized result
- Consolidate redundant checks — seven separate per-column null checks collapsed into a single aggregation pass
- Eliminate duplicate calls — multiple checks were computing the same value twice (once for pass/fail, once for the log message) with no caching between them
- Unpersist after the write — releases the cached frame from memory cleanly
Step 7 — Measure the result
After applying the fix and running the pipeline once cleanly, the per-run CU-seconds were read from the TimePoint Detail drill-down in the Capacity Metrics app:
| Notebook | Before (CU-sec/run) | After (CU-sec/run) | Reduction |
|---|---|---|---|
| nb_gold_fact_sales | 18,795.62 | 4,885.04 | 74.0% |
| nb_silver_sales_order | 19,242.14 | 9,761.57 | 49.3% |
| Combined | 38,037.76 | 14,646.61 | 61.5% |
Worth being precise about two figures that look like they should match and don't. The 61.6% from Step 2 is a 14-day blended attribution — it answers "where did cost concentrate across all runs." The 61.5% here is a clean, single-run, per-run-normalized before/after — it answers "did the fix work and by how much." Getting the second number right required ruling out three measurement traps one by one:
- Duration ≠ CU-seconds — do not use session duration as a proxy
- Cross-filter state — the capacity dashboard can be silently filtered to one item while still showing what looks like a workspace total; always check the filter pane
- Multi-run days — a single calendar day's CU total can bundle multiple pipeline runs; one "before" day had five runs compressed into one bar, which would have overstated the reduction by roughly 5× if used directly
Once each of those was ruled out, 61.5% is the number that holds up — and the 14-day aggregate view in the Capacity Metrics app confirms the overall workload profile shifted accordingly.
Part 7 — Orchestration: Wiring Five Notebooks Without Losing Control of Cost or Visibility
Before starting this part: All five Silver notebooks (nb_silver_sales_order, nb_silver_address, nb_silver_employee, nb_silver_product, nb_silver_territory) and the Gold notebook (nb_gold_fact_sales) must be individually tested and running without errors. The Bronze ingestion pipeline must be verified working. Complete the FinOps caching fix from Part 6 before building the orchestration — otherwise the pipeline will schedule the inefficient version.
With governance, reporting, and FinOps all in place independently, the next problem was tying the whole chain into one schedulable pipeline. The design: a fan-out from Bronze ingestion into five parallel Silver notebooks, converging into a single Gold fan-in, with Fabric's AND-logic dependency handling the convergence automatically once all five success arrows are wired in.
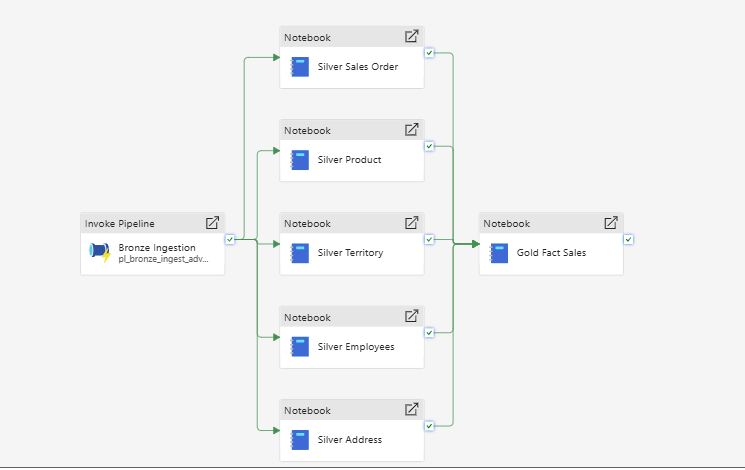
pl_full_medallion_run after a clean end-to-end pass — all six activities succeeded
The ForEach decision
Collapsing the five Silver notebooks into a single ForEach activity was considered and rejected. Fabric's "rerun from failed activity" reruns an entire ForEach loop — including iterations that already succeeded — with no native way to retry only the one that failed. The FinOps work above was specifically about eliminating wasted compute; burning CU-seconds re-running four notebooks that already passed just to retry the one that didn't would have undone exactly that discipline. Five separate activities cost more canvas space. They buy back selective reruns and per-notebook visibility in the monitor. For this project's priorities, that is the right trade-off.
Setting Up Workspace Identity and the Pipeline Connection
Before the pipeline activities can authenticate without user credentials, two infrastructure layers need to be in place: a tenant-level permission and a workspace-level identity. Setting these up is the prerequisite that the Connection field on Notebook and pipeline activities depends on.
Step 1 — Enable the tenant setting for service principals
In Admin portal → Tenant settings → Developer settings, enable "Service principals can call Fabric public APIs" and scope it to the AW-POC-Admins security group:
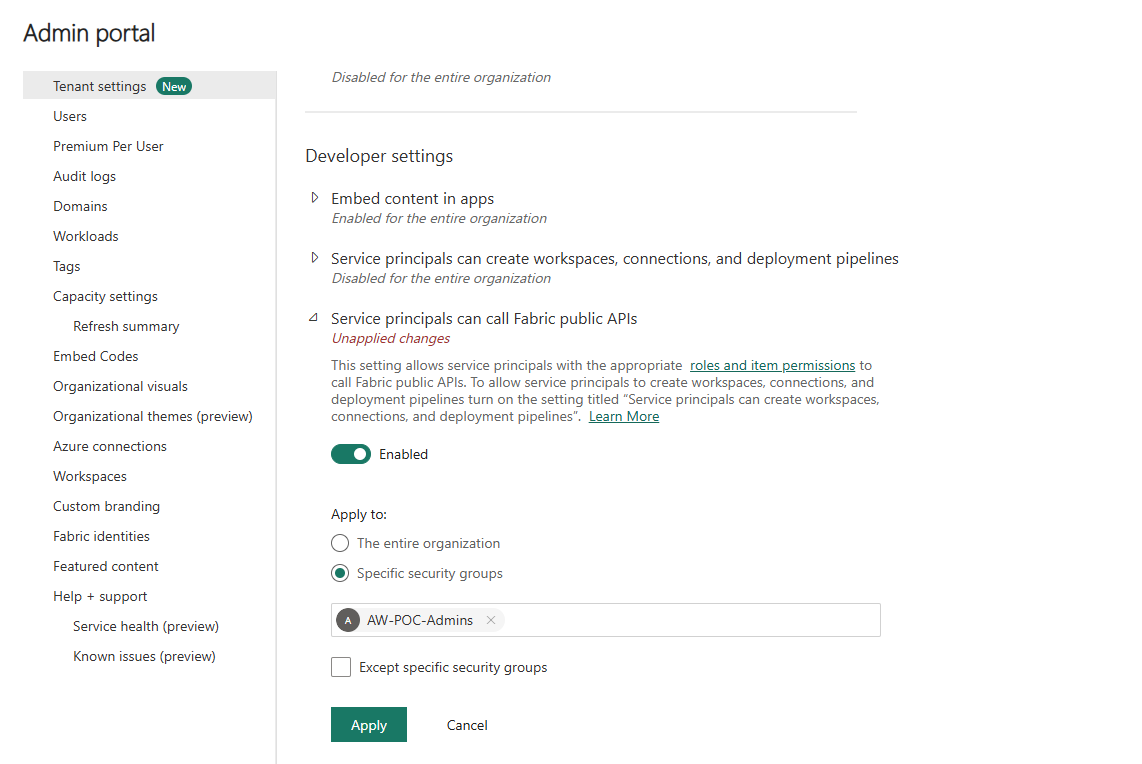
Developer settings — "Service principals can call Fabric public APIs" enabled for the AW-POC-Admins group. Without this, any Workspace Identity or service principal attempting to authenticate against Fabric APIs will be rejected at the tenant level regardless of workspace role.
This setting is the gate that determines whether service principals (including Workspace Identities) can interact with Fabric at all. It is separate from workspace roles and separate from Entra group membership — all three layers must be consistent.
Step 2 — Create the Workspace Identity
In Workspace Settings → Workspace identity, click + Workspace identity to create the managed identity for this workspace:
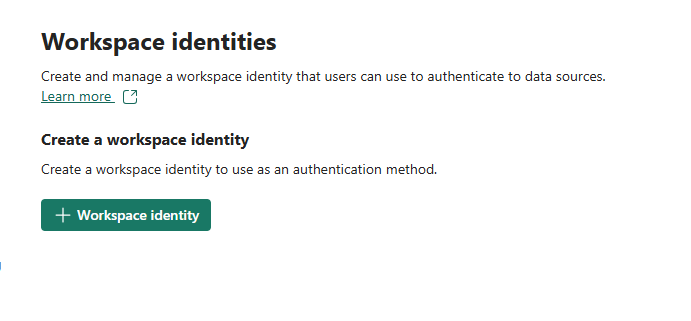
Before creation — the Workspace identity tab shows only the creation button. One click provisions the managed identity; no naming required as it takes the workspace name automatically.
Once created, the identity details page shows the provisioned service principal and its authorized users:
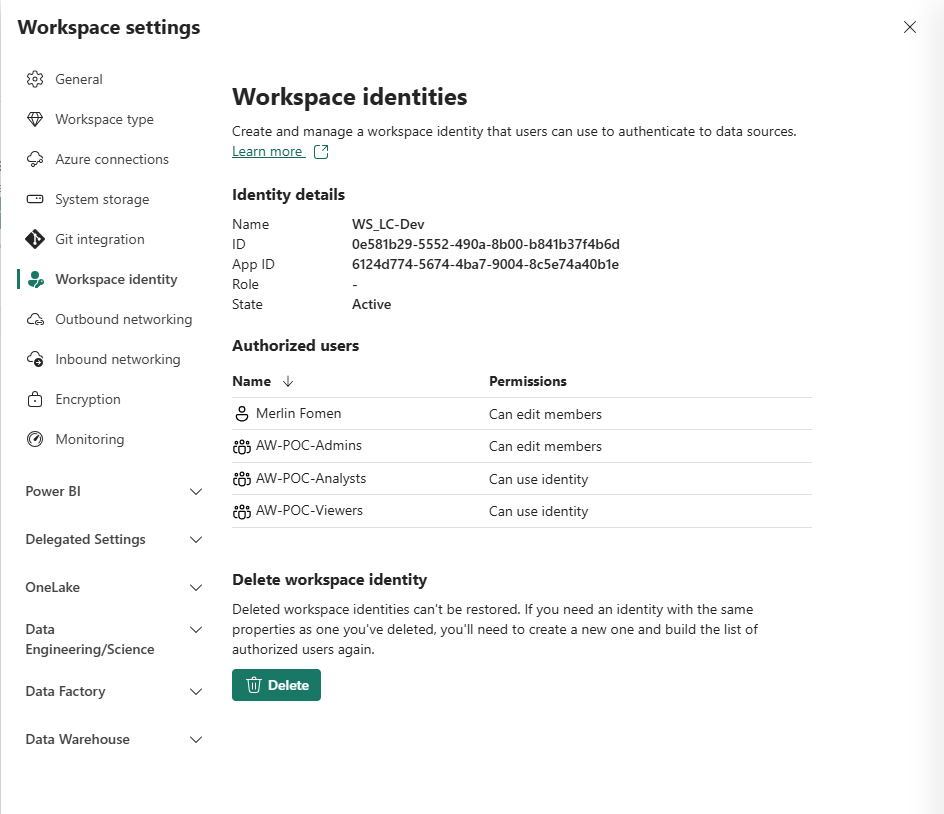
Workspace identity WS_LC-Dev — State: Active. Authorized users: Merlin Fomen and AW-POC-Admins with "Can edit members"; AW-POC-Analysts and AW-POC-Viewers with "Can use identity". All three security groups are present, giving each role the correct level of access to the identity.
The identity is named WS_LC-Dev (matching the workspace), with Object ID 0e581b29-5552-490a-8b00-b841b37f4b6d and App ID 6124d774-5674-4ba7-9004-8c5e74a40b1e. These IDs are what appear in Entra and in audit logs when the identity authenticates.
The permission model for authorized users is deliberately tiered:
| Principal | Permission | What it means |
|---|---|---|
| Merlin Fomen | Can edit members | Can add/remove authorized users |
| AW-POC-Admins | Can edit members | Group-level admin over identity membership |
| AW-POC-Analysts | Can use identity | Can authenticate as this identity (e.g. for notebooks) |
| AW-POC-Viewers | Can use identity | Can authenticate as this identity (read-only context) |
Step 3 — Add the service principal directly to the Entra security group
This is the step most documentation skips, and the one that caused the permissions error in this project. The Workspace Identity being listed in Workspace Settings is not sufficient for it to authenticate through a connection that itself is scoped to a security group. The service principal must be a direct member of the Entra security group that governs the permission boundary.
In Entra ID → Groups → AW-POC-Admins → Members:
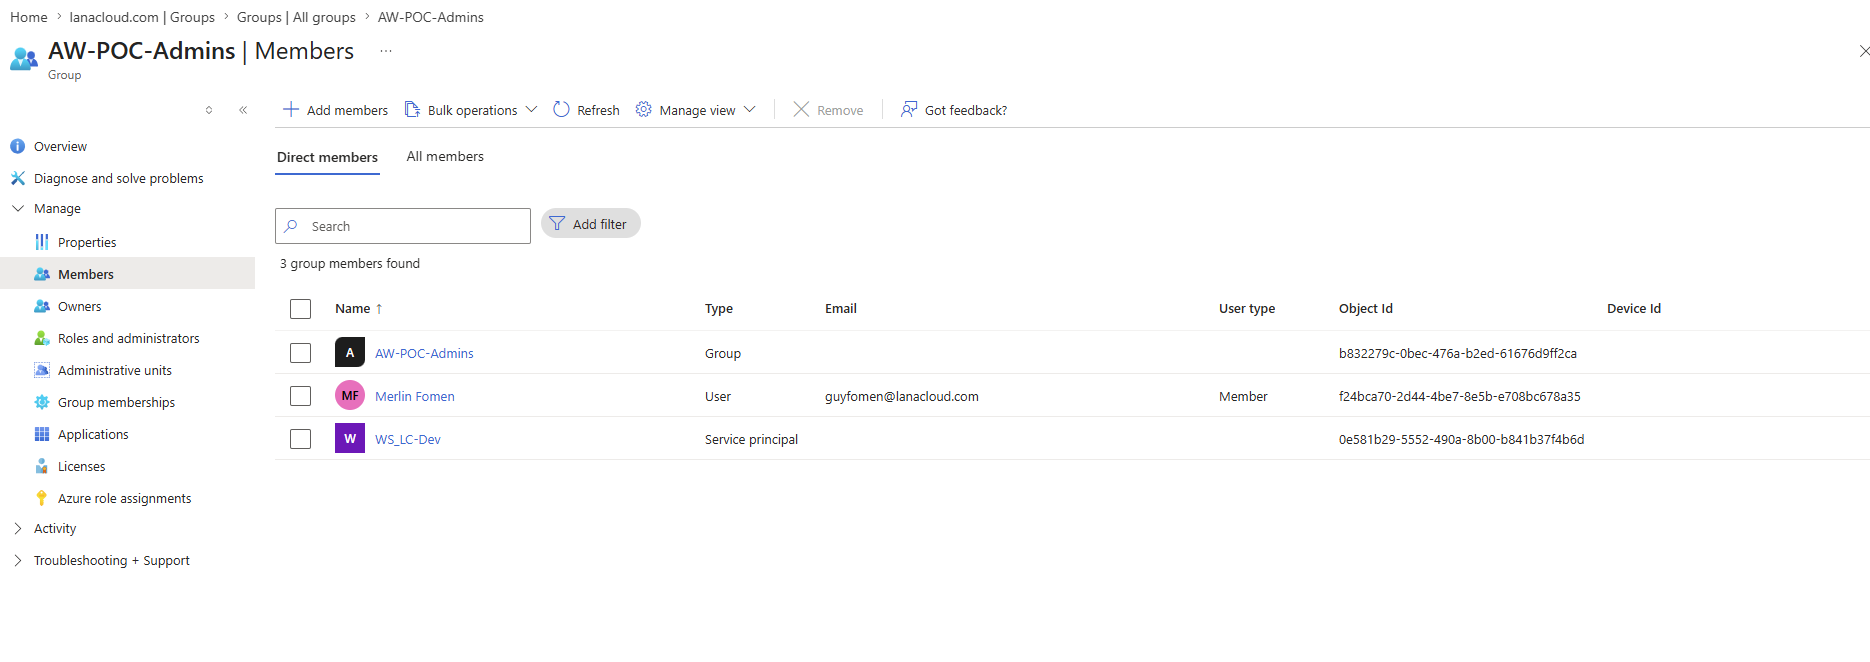
AW-POC-Admins members in Entra — three entries: the group itself (nested), Merlin Fomen (user, guyfomen@lanacloud.com), and WS_LC-Dev (service principal, Object ID: 0e581b29...). The Object ID matches the Workspace Identity ID exactly.
Three members are visible: the group itself (a nested reference), Merlin Fomen as a direct user member, and WS_LC-Dev as a Service principal — the Workspace Identity, identifiable by its Object ID (0e581b29-5552-490a-8b00-b841b37f4b6d) which matches what the Workspace Settings panel shows. Without this entry, any pipeline activity running under the Workspace Identity that hits a permission boundary checked at the Entra group level will fail — even if the workspace role assignment looks correct from the Fabric UI.
Step 4 — Create the nb_connection for Fabric Data Pipelines
With the identity in place, create the connection object that pipeline activities can reference. In Manage connections and gateways → New connection → Cloud:
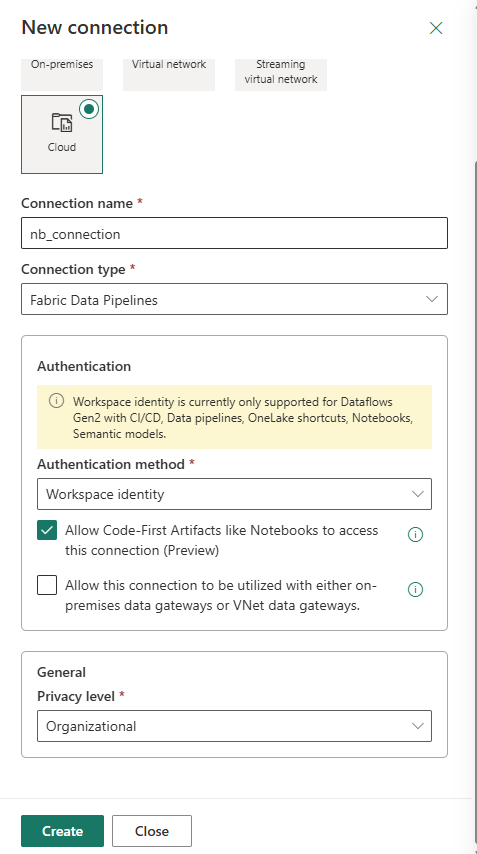
New connection — Cloud type, Fabric Data Pipelines connector, Workspace identity authentication. "Allow Code-First Artifacts like Notebooks to access this connection (Preview)" checked — this is what makes the connection usable by Notebook activities. Privacy level: Organizational.
Key settings on this form:
- Connection type: Cloud — not on-premises; Workspace Identity authenticates through Azure, not through a gateway
- Connection name: nb_connection — used by Invoke Pipeline (Preview) activities
- Authentication method: Workspace identity — the WS_LC-Dev managed identity authenticates the pipeline run
- "Allow Code-First Artifacts like Notebooks to access this connection" (Preview) — must be checked for Notebook activities to reference this connection. This is the checkbox that makes the connection visible in the Notebook activity's Connection field dropdown
The yellow note on the form is worth reading: Workspace Identity authentication is currently supported for Dataflows Gen2 with CI/CD, Data pipelines, OneLake shortcuts, Notebooks, and Semantic models — the specific activity types that can use this connection.
Full connection inventory
After all connection objects are created across the project, the Manage Connections and Gateways page serves as a project-level infrastructure checklist:
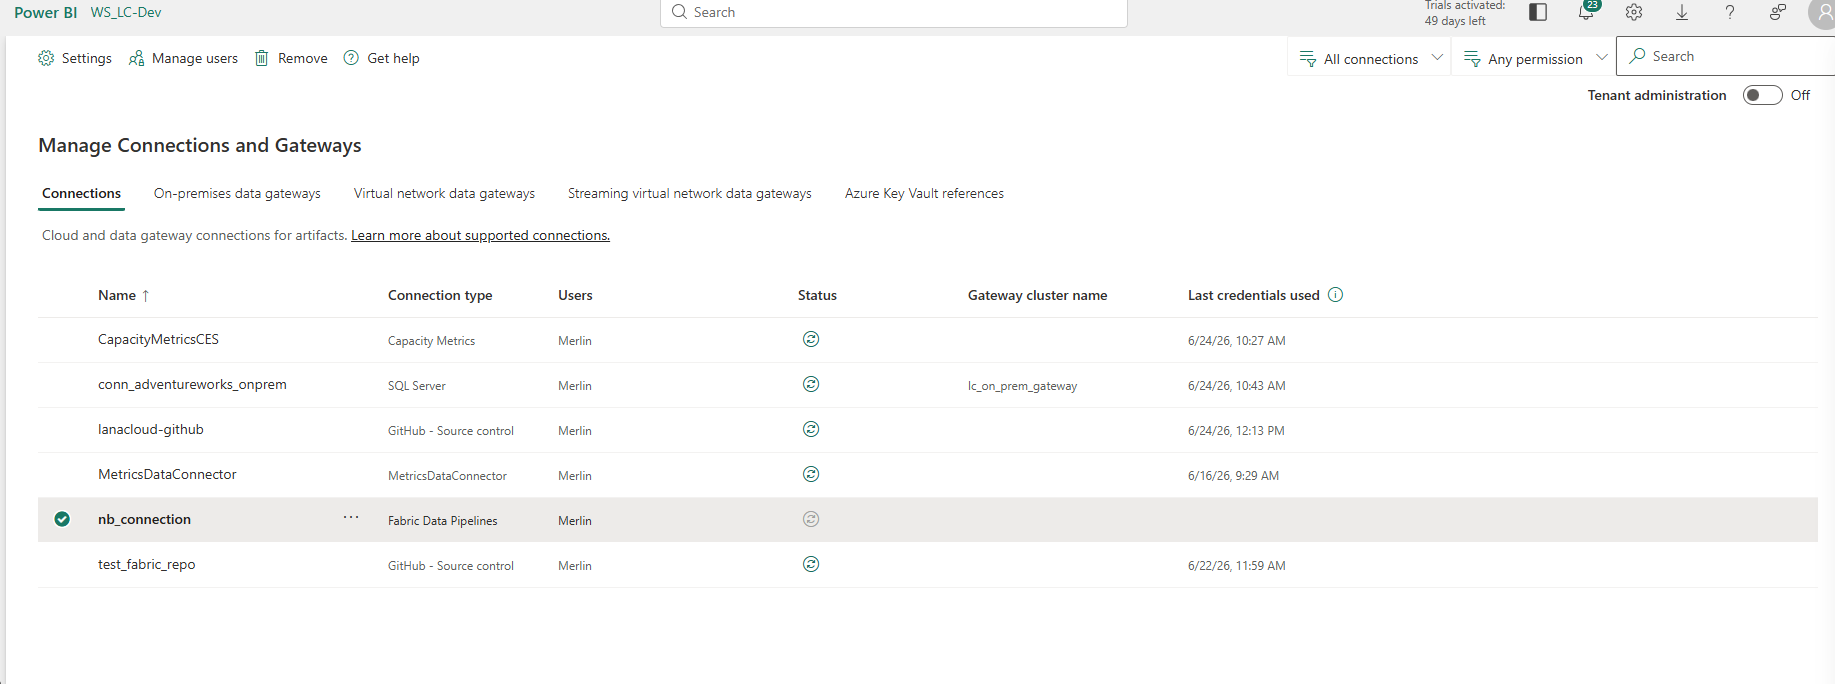
Manage Connections and Gateways — the full connection inventory for this project. Every external integration is visible in one place with its type, status, gateway (where applicable), and last credentials used timestamp.
| Connection | Type | Purpose |
|---|---|---|
CapacityMetricsCES |
Capacity Metrics | Powers the Fabric Capacity Metrics app (Part 6) |
conn_adventureworks_onprem |
SQL Server | On-premises AdventureWorks source via lc_on_prem_gateway |
lanacloud-github |
GitHub - Source control | Git integration for the workspace (Part 5) |
MetricsDataConnector |
MetricsDataConnector | Metrics telemetry connection |
nb_connection |
Fabric Data Pipelines | Workspace Identity auth for pipeline/notebook activities |
test_fabric_repo |
GitHub - Source control | Test repository used during Git integration debugging |
All six show green (healthy) status. The conn_adventureworks_onprem entry confirms the on-premises gateway (lc_on_prem_gateway) is active and credentials were last used on 6/24/26 at 10:43 AM — evidence of a successful pipeline run.
Two bugs that look similar and aren't
Wiring the Bronze step into the orchestration pipeline surfaced two distinct platform issues:
First: the Notebook activity's Connection field — meant to reference nb_connection and authenticate via Workspace Identity — stayed empty in the dropdown regardless of configuration, a confirmed platform rollout gap. The nb_connection object, the Workspace Identity, and the Entra group membership are all correctly in place (documented above); the activity's field simply does not yet populate from them on this backend cluster. It is an optional field, so all six Notebook activities run with it blank for now — the infrastructure will be used automatically once the rollout reaches this workspace.
Second: the Invoke Pipeline (Legacy) activity cannot show the child pipeline's progress while running. Switching to Invoke Pipeline (Preview) fixed the visibility issue, but its Connection field is required — a different rule than the Notebook activity, on the same general feature. Using nb_connection here worked, but surfaced a permissions error: the Workspace Identity was listed in Workspace Settings as an authorized user, yet the pipeline still failed to authenticate. The root cause was the missing Entra group membership shown in secur_indentity_4.png — the service principal must be a direct member of the Entra group, not merely referenced via Workspace Settings. Adding WS_LC-Dev directly to AW-POC-Admins in Entra (Step 3 above) resolved it. Same shape of problem as the certification work in Part 4: indirect membership is not equivalent to direct access, and Fabric checks at the Entra layer.
With both resolved, the pipeline runs on a fixed weekly schedule — Sunday at midnight Eastern — closing the loop from "things I run manually" to "things that run themselves."
Part 8 — Closing the Loop: Observability and Alerting
Before starting this part: The orchestration pipeline pl_full_medallion_run must be created, scheduled, and have completed at least one run (Part 7 complete). Workspace admin access is required to enable Workspace Monitoring. A Data Activator item will be created in this part — it requires no additional licences on an F-SKU capacity.
A pipeline that runs on a schedule with nobody watching it isn't finished — it just fails quietly instead of loudly. The last piece was making failures visible without babysitting the workspace.
Workspace Monitoring + KQL
Step 1 — Enable Workspace Monitoring and understand what it provisions
In Workspace Settings → Workspace Monitoring, flip the toggle on. Fabric automatically provisions:
- A Monitoring Eventhouse — a real-time analytics database backed by Kusto/KQL
- A Monitoring KQL database inside the Eventhouse — pre-populated with a rich table catalog
- A Monitoring Eventstream — built on a native
FabricMonitoringsource connector that continuously streams workspace telemetry into the Eventhouse
The Eventstream architecture is worth understanding before you write a single KQL query:
The Eventstream architecture: FabricMonitoring (built-in source, Active) → Monitoring_Eventstream → FabricMonitoringDestination (Active). The Data preview tab shows raw JSON telemetry records — cluster FQDN, node name, timestamp, and Azure resource ID — flowing continuously.
The Data insights tab shows the live message throughput — IncomingMessages vs OutgoingMessages over the last hour, spiking during pipeline run windows:
Data insights — message count spikes correspond to pipeline activity windows. The stream is active and routing telemetry from the FabricMonitoring source to the Eventhouse destination continuously.
Step 2 — Check the Eventhouse System Overview before writing queries
Before querying the data, open the Monitoring Eventhouse → System overview. It gives you a health dashboard for the monitoring infrastructure itself:
System overview — 3.2 MB of raw telemetry compressed to 752.1 KB (76% compression). Activity breakdown: KQL QuerySet, Data Activator, and System processes. Advisor finding: Data Activator is driving ~54% of total query load — expected, since the Activator polls every hour.
Several details from this screen are worth noting:
- Compression ratio: 76% — Eventhouse's columnar storage compresses telemetry data aggressively. 3.2 MB of raw JSON events lands as 752.1 KB on disk. This is not unusual for structured log data with many repeated field names and values.
- Always-on: Off — the Eventhouse pauses when idle, releasing capacity CU. For a monitoring workload driven by occasional queries and hourly Activator polls, this is the correct setting. Turning it on would keep the cluster warm 24/7 at unnecessary cost.
- Advisor finding: Query spike — the advisor flagged that Data Activator is driving unusually high query activity, contributing ~54% of total usage. This is expected behaviour — the Activator rule polls the KQL database every hour. It is not a problem, but knowing the Eventhouse advisor surfaces this automatically means you can use it to catch genuinely unexpected query patterns in production.
- Activity breakdown shows four consumers: KQL QuerySet (your manual queries), Data Activator (the alerting rule), and two system processes (Storage Cleaning, Shard Management). All are visible and attributable.
Step 3 — Understand the full table catalog before narrowing to ItemJobEventLogs
The Monitoring KQL database contains far more than the one table mentioned in most tutorials:
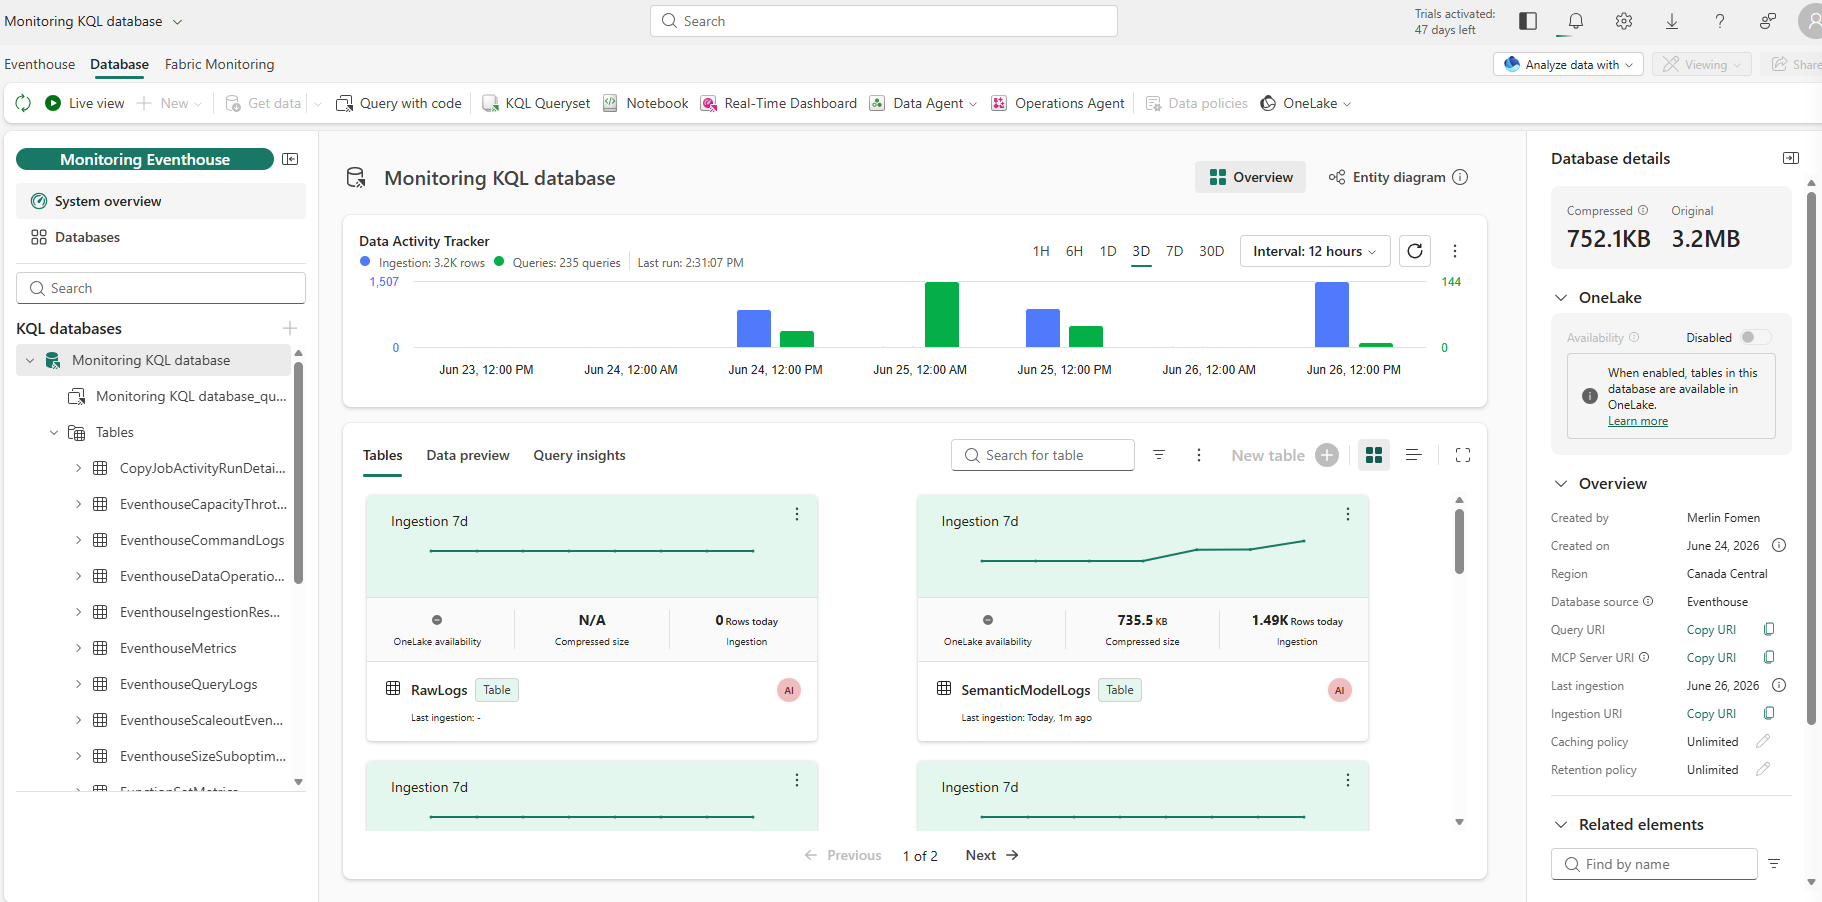
Monitoring KQL database — the full table catalog (left panel) includes pipeline logs, Eventhouse self-monitoring, semantic model query logs, and more. Data Activity Tracker: 3.2K ingestion rows and 235 queries over 3 days. SemanticModelLogs: 1.49K rows ingested today.
The full table catalog visible in the left panel:
| Table | What it captures |
|---|---|
ItemJobEventLogs |
Pipeline and notebook job start/end events — the table used in this blog |
SemanticModelLogs |
Power BI semantic model query activity — who queried what, when, how long |
EventhouseMetrics |
Eventhouse cluster-level performance metrics |
EventhouseQueryLogs |
Every KQL query run against the Eventhouse |
EventhouseCommandLogs |
Schema changes and admin commands |
EventhouseIngestionResults |
Ingestion success/failure per batch |
GraphQLLogs / GraphQLMetrics |
Activity on any GraphQL endpoints in the workspace |
CopyJobActivityRunDetails |
Copy activity-level details for Data Factory pipelines |
MirroredDatabaseLogs |
Mirrored database sync events |
RawLogs |
Raw platform telemetry (lower-level than ItemJobEventLogs) |
This catalog is the full monitoring surface of a Fabric workspace — pipelines, notebooks, semantic models, Eventhouse internals, and GraphQL endpoints all in one queryable database. ItemJobEventLogs is the entry point for pipeline monitoring, but SemanticModelLogs is equally valuable once the executive report is in production and you want to understand query performance and user adoption.
Step 4 — Explore with the Stats tab before building production queries
Before using a KQL query in Activator or saving it to a dashboard, validate it with the Stats tab in the KQL Queryset. It shows execution time, memory, CPU, and cache behaviour — the same metrics that determine whether a query is appropriate for high-frequency polling:
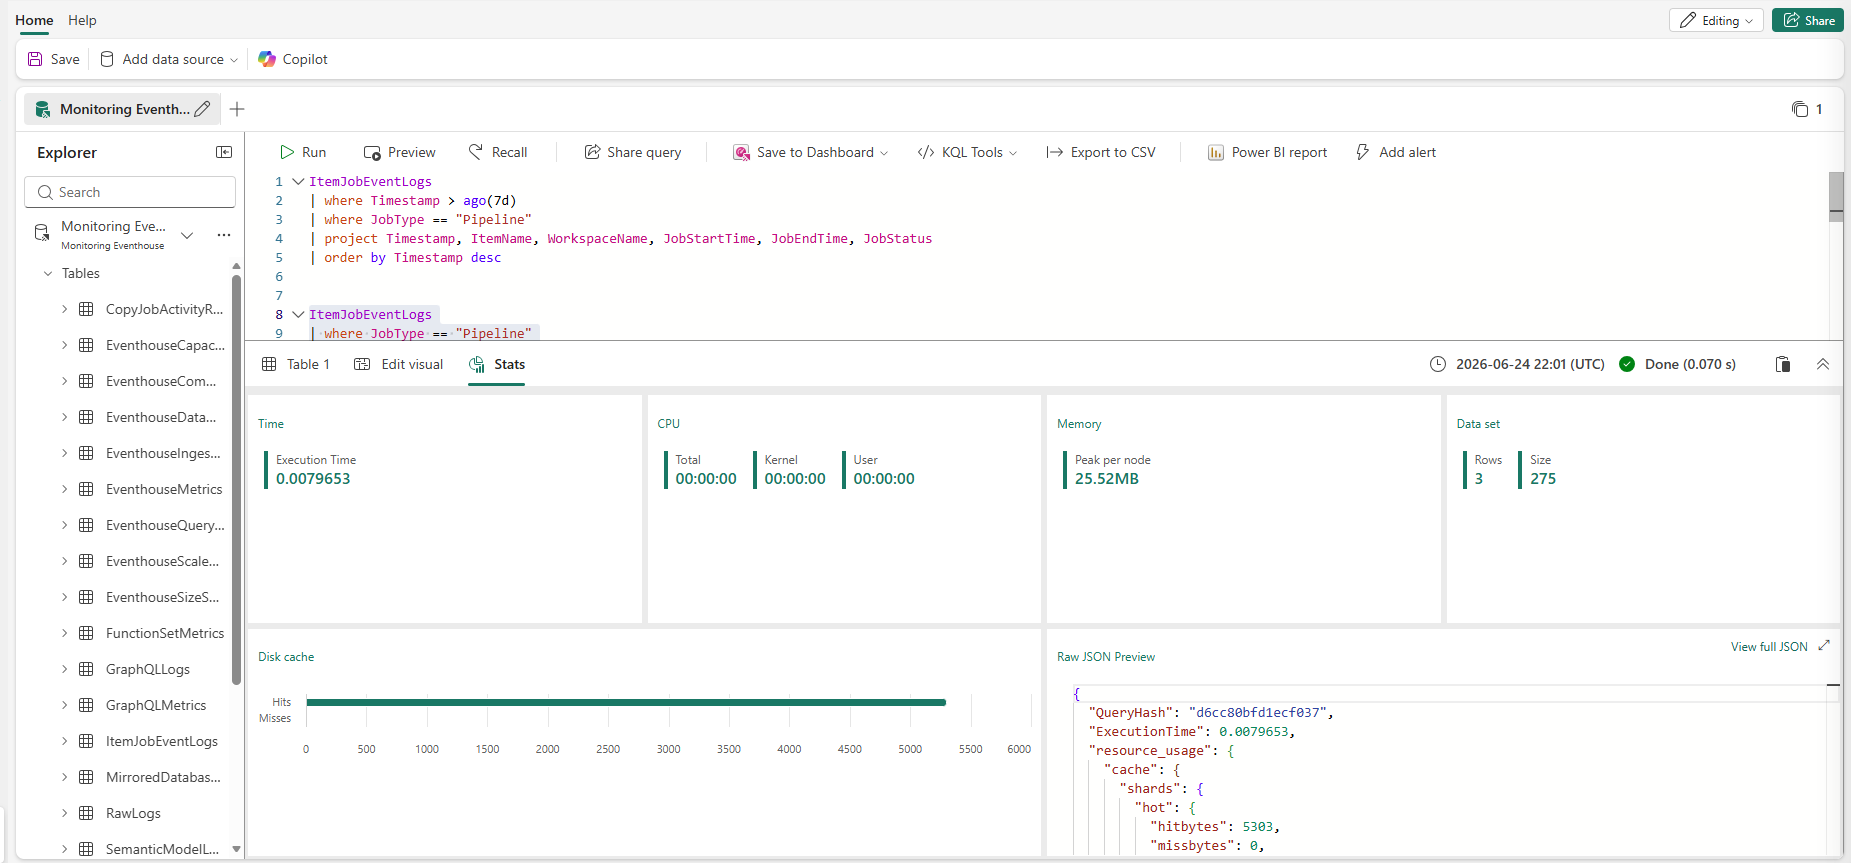
Stats tab — execution time: 7.9ms. Disk cache: 100% hits (entire green bar, no misses). Memory: 25.52 MB peak. 3 rows, 275 bytes returned. This query is well within the bounds of safe hourly polling.
The query running here is a simple pipeline log exploration:
ItemJobEventLogs
| where Timestamp > ago(7d)
| where JobType == "Pipeline"
| project Timestamp, ItemName, WorkspaceName, JobStartTime, JobEndTime, JobStatus
| order by Timestamp desc
Execution time: 7.9 milliseconds. Disk cache: 100% hits — the monitoring data is hot in Eventhouse memory, meaning repeated queries by Activator or interactive analysts do not re-read from disk. Memory footprint: 25.52 MB. This is the performance profile of a database designed for fast, repeated operational queries — not batch analytics.
Step 5 — The ItemJobEventLogs schema gotcha
The schema has one critical detail to understand before writing anything more complex than a basic filter: ItemJobEventLogs logs one row per status transition — NotStarted → InProgress → Completed (or Failed) — not one row per run. Only the terminal row has both a JobStartTime and JobEndTime populated. Any aggregation that doesn't filter on isnotempty(JobEndTime) silently multiplies every run count by 3.
A reliable first query to understand what the table contains:
ItemJobEventLogs
| where Timestamp > ago(7d)
| where JobType == "Pipeline"
| project Timestamp, ItemName, WorkspaceName, JobStartTime, JobEndTime, JobStatus
| order by Timestamp desc
This returns only rows where a pipeline event occurred in the last 7 days, projected to the columns you actually need. From here you can add the isnotempty(JobEndTime) filter to isolate terminal rows before any duration or attribution calculations.
Step 6 — Cross-join attribution: parent and child pipelines
With the schema understood, a more sophisticated query correlates the parent pipeline's run window against the Bronze ingestion child pipeline's run window — since the Workspace Monitoring schema has no shared run ID linking parent to child:
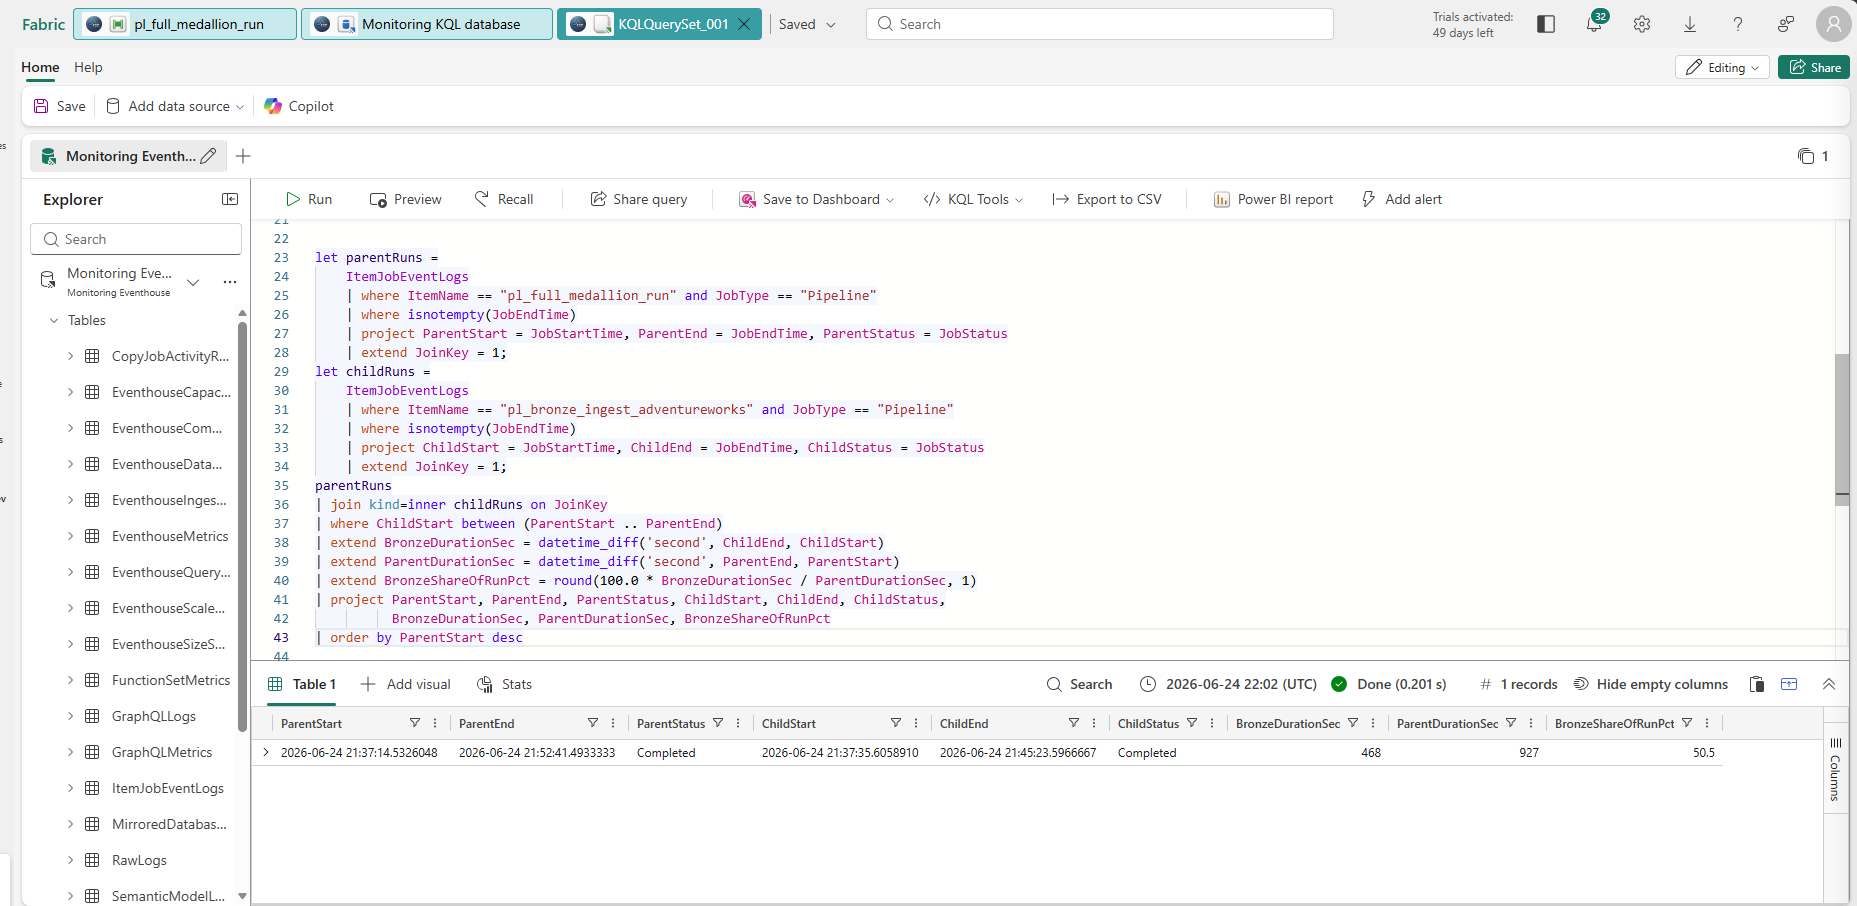
Cross-join query result — ParentDurationSec: 927s, BronzeDurationSec: 468s, BronzeShareOfRunPct: 50.5. Done in 0.201s. Bronze Ingestion consumed exactly half the end-to-end wall-clock time.
That detail unlocked a cross-join correlating the parent pipeline's run window against its invoked child's run window by time containment — since there is no shared run ID linking them in this schema:
let parentRuns =
    ItemJobEventLogs
    | where ItemName == "pl_full_medallion_run" and JobType == "Pipeline"
    | where isnotempty(JobEndTime)
    | project ParentStart = JobStartTime, ParentEnd = JobEndTime, ParentStatus = JobStatus
    | extend JoinKey = 1;
let childRuns =
    ItemJobEventLogs
    | where ItemName == "pl_bronze_ingest_adventureworks" and JobType == "Pipeline"
    | where isnotempty(JobEndTime)
    | project ChildStart = JobStartTime, ChildEnd = JobEndTime, ChildStatus = JobStatus
    | extend JoinKey = 1;
parentRuns
| join kind=inner childRuns on JoinKey
| where ChildStart between (ParentStart .. ParentEnd)
| extend BronzeDurationSec    = datetime_diff('second', ChildEnd, ChildStart)
| extend ParentDurationSec    = datetime_diff('second', ParentEnd, ParentStart)
| extend BronzeShareOfRunPct  = round(100.0 * BronzeDurationSec / ParentDurationSec, 1)
| project ParentStart, ParentEnd, ParentStatus,
          ChildStart, ChildEnd, ChildStatus,
          BronzeDurationSec, ParentDurationSec, BronzeShareOfRunPct
| order by ParentStart desc
Result: Bronze Ingestion accounts for 50.5% of the full orchestrated pipeline's total runtime
Against a real run, that returned a genuine, specific number: Bronze Ingestion accounts for 50.5% of the full orchestrated pipeline's runtime — half the total wall-clock time spent on ingestion alone, pulled from real log data rather than a generic demo statistic.
Activator alerting: a heartbeat pattern, not a failure-event pattern
With monitoring in place, the last piece was automatic failure notification. The approach here is worth explaining carefully, because it is architecturally different from what most tutorials show.
The naive approach to pipeline alerting is: watch for a failure event and send a notification when one appears. The pattern used here is the opposite — watch for a success heartbeat, and alert when that heartbeat goes silent. This is sometimes called a dead man's switch. It is more robust in practice because it catches failures that produce no event at all (hung processes, capacity throttling, silent timeouts) — not just failures that emit a clean error record.
Step 1 — Connect the event source
In My Activator, create a new event source of type KQL Queryset and point it at the Monitoring KQL database provisioned by Workspace Monitoring. Set the poll interval to 1 hour — matching the pipeline's weekly cadence with sufficient granularity to detect same-day issues.
The query powering the event source feeds Activator a stream of completed pipeline records:
ItemJobEventLogs
| extend SecondsAgo = datetime_diff('second', now(), ingestion_time())
| where JobType == "Pipeline" and JobStatus == "Completed"
| order by Timestamp desc
| project Timestamp, ItemName, WorkspaceName, JobStartTime, JobEndTime, JobStatus
This query filters for JobStatus == "Completed" — so every row Activator receives represents a successful pipeline completion. That successful completion is the heartbeat.
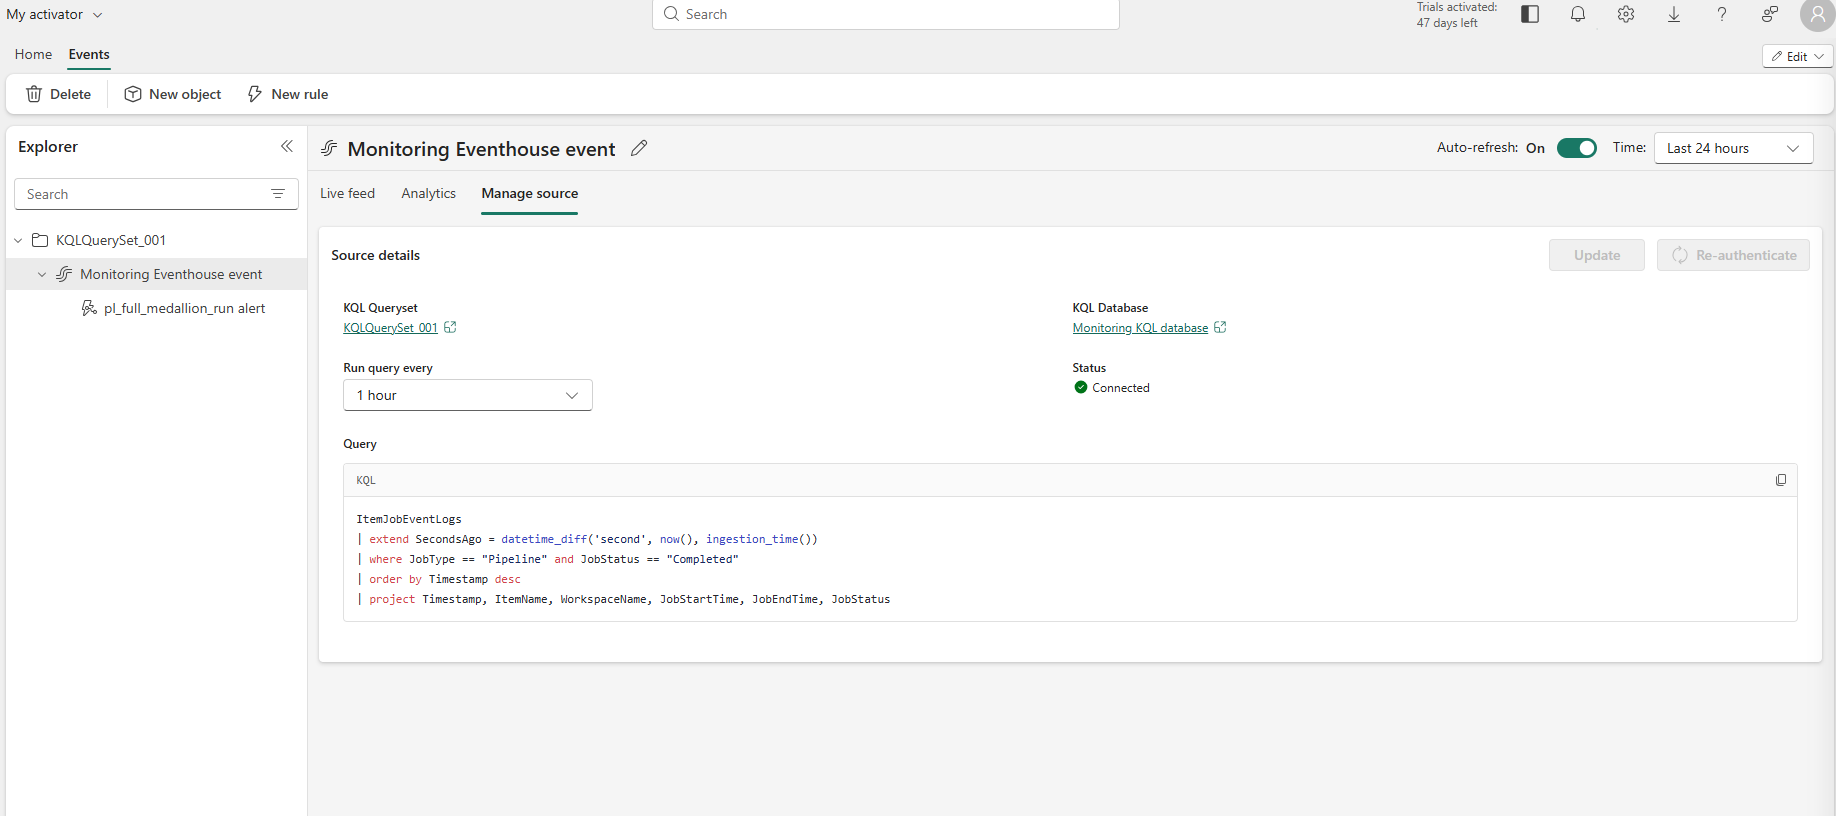
Manage source — the KQL queryset polls ItemJobEventLogs every hour, projecting completed pipeline records as the heartbeat stream
Once connected, the Live feed tab confirms the event stream is receiving rows. Both pl_full_medallion_run and pl_bronze_ingest_adventureworks appear in the ItemName column — meaning Activator is tracking both the parent orchestration pipeline and the Bronze ingestion child pipeline from the same event source without any additional configuration.
Step 2 — Define the rule
Create a new rule on the event source. The critical choice is the condition type. Do not use "On every value" — that fires an alert every time a pipeline succeeds, which is noise, not signal.
The correct condition is "No presence of data" with a time elapsed of 10 minutes. In plain terms: if no completed-pipeline heartbeat arrives within a 10-minute window, the rule fires. Silence is the failure signal.
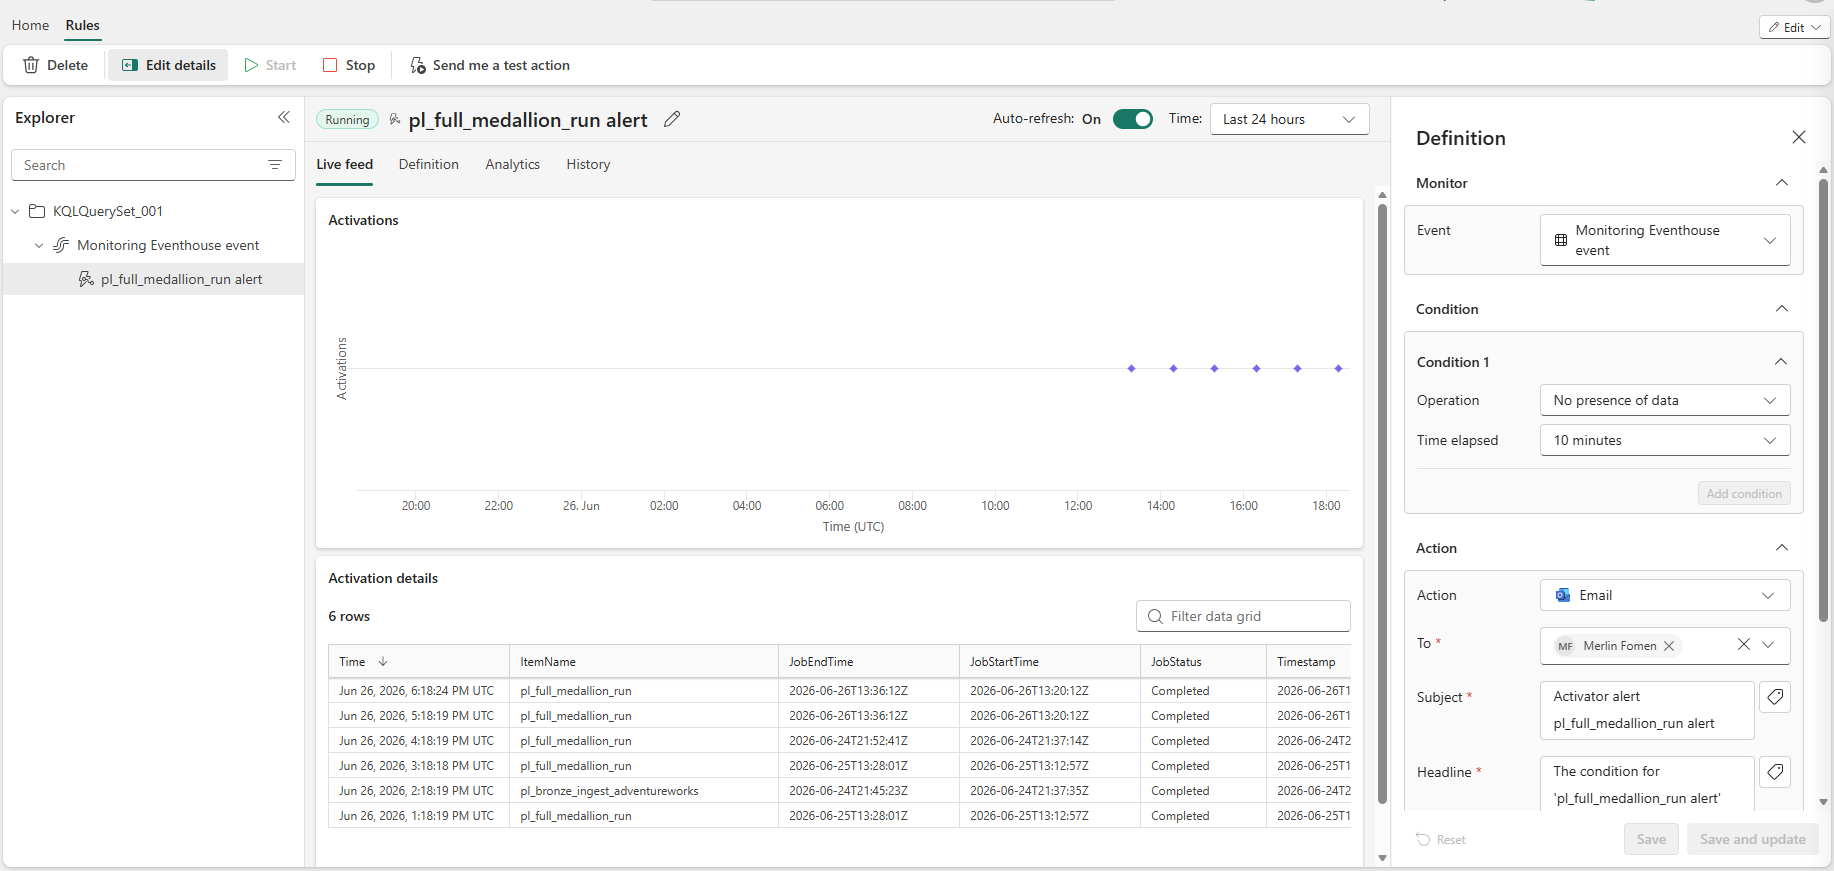
Rule definition — condition: "No presence of data / 10 minutes". Action: Email. The activation details table confirms real pipeline run timestamps are flowing through the event source.
The Definition panel (right side) summarises the complete rule:
| Setting | Value |
|---|---|
| Monitor | Monitoring Eventhouse event |
| Condition | No presence of data |
| Time elapsed | 10 minutes |
| Action | |
| Subject | Activator alert pl_full_medallion_run alert |
| Headline | The condition for 'pl_full_medallion_run alert' has been met |
The Definition tab also labels the condition as "No heartbeat" — the exact mental model. As long as the pipeline completes on schedule, the heartbeat arrives and the rule stays quiet. The moment the pipeline fails, stalls, or never starts, the heartbeat stops and the alert fires within 10 minutes.
Step 3 — Verify in History
The History tab is the ground truth for whether the rule is working. Do not trust "Running" status alone — verify actual activations.
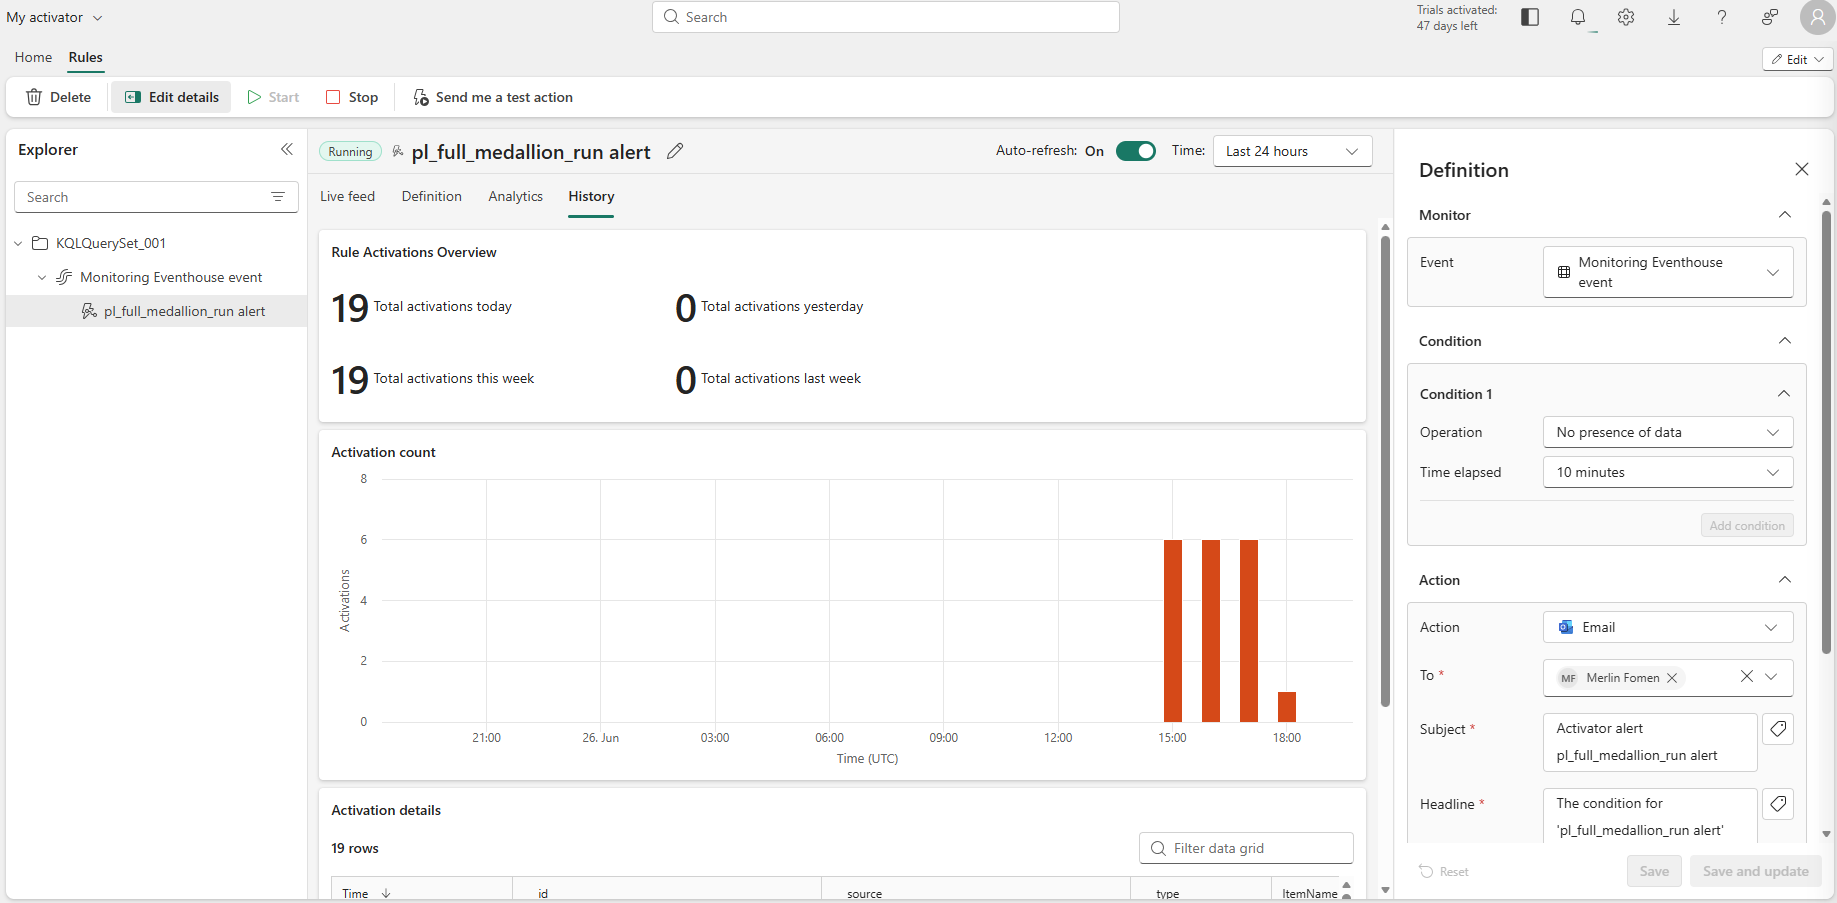
History — 19 total activations confirmed today, clustered around 15:00, 16:00, and 18:00 UTC — correlating exactly with the pipeline run windows visible in the KQL event feed
The History tab showed 19 total activations (all this week, none the prior week — meaning the rule was new and the count is clean, not inherited from a prior configuration). The activation bar chart shows three distinct clusters corresponding to the three pipeline run windows executed during testing on June 26. Each cluster maps directly to a period where the event source received a burst of completed-pipeline records, confirming the rule is firing on real activity — not on background platform noise or test presses.
What This Build Demonstrates
This project covers the full production surface of Microsoft Fabric well beyond the quickstart happy path:
| Capability | What Was Demonstrated |
|---|---|
| Ingestion | On-prem SQL Server → Bronze via gateway + scheduled pipeline |
| Transformation | Medallion Bronze → Silver → Gold in PySpark with a shared DQ framework |
| Modeling | Direct Lake semantic model, window functions, continuous calendar, fan-out resolution |
| Governance | RLS + OLS enforced, OneLake security, certification workflow, audit logging |
| FinOps | 61.5% compute reduction, F8 right-sizing recommendation from measured peak draw |
| Orchestration | Fan-out / fan-in pipeline, selective-rerun-aware design, weekly schedule |
| Observability | Workspace Monitoring KQL, cross-join attribution query, Activator email alerting |
| Platform debugging | Backend bug isolated by controlled single-variable elimination test |
The more important point is the method behind each one: every number is sourced, every security claim is tested against a real identity, every architectural decision has a documented reason, and every platform failure has a root cause — not just a workaround.